The binary score hides the near-misses
I posted this on X after finishing two full runs of DeepSWE, and it turned into the most interesting question of the whole exercise, so here is the long version.
The published numbers place MiMo-v2.6-Flash above GLM-5.3-Flash (about 68% against about 63%). In daily use I would have sworn the opposite was true. So I ran the whole 113-task corpus against both, locally, same harness, same task order — and then looked at how the grading actually works.
How DeepSWE scores
Each of the 113 tasks is graded on a hidden test suite split in two. The fail-to-pass tests are the behavior the change is supposed to introduce. The pass-to-pass tests are the repository’s existing suite, which must not regress.
The score for a task is 1 if every f2p test passes and no p2p test fails. Otherwise it is 0. The headline number — Pass@1 — is the share of tasks that scored 1.
That is a defensible definition of “did it ship”. It is also, as a summary of a model’s capability, throwing away almost everything the run measured.
The two numbers from the same runs
Both of these come from my two local runs of the same 113 tasks:
| GLM-5.3-Flash | MiMo-V2.6-Flash-MOPD | |
|---|---|---|
| Tasks resolved (official-style binary score) | 76/113 = 67.3% | 71/113 = 62.8% |
| Target tests passed, pooled over the corpus | 5,723/5,877 = 97.38% | 5,555/5,877 = 94.52% |
| Target tests passed, mean per task | 94.71% | 90.59% |
| Tasks where every target test passed | 79 | 74 |
| Tasks where 90–99% of target tests passed | 25 | 23 |
Two models, 113 tasks, and between them 48 tasks where the model got between nine and ten out of every ten target tests right — and scored zero for it.
Why that is structural, not bad luck
The tasks are not the same size. Not remotely:
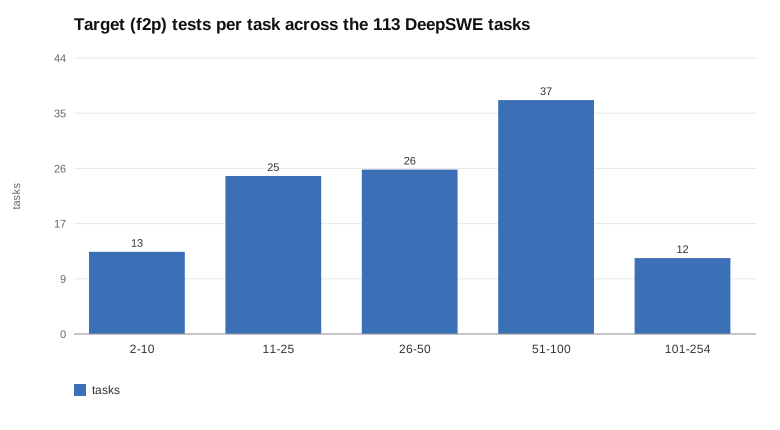
The median task carries 44 target tests; the range runs from 2 to 254. Thirteen tasks have ten target tests or fewer; twelve have a hundred or more. The regression suites are even more skewed — one task in the corpus has 66,265 of them, and the median is 165.
The binary rule gives every task the same weight — one point — regardless of how much behavior that task encodes. Three consequences follow, and all three showed up in my data:
1. Failing one assertion and failing all of them are the same event. kysely-window-grouping-helpers has 254 target tests. A model that passes 253 of them scores zero, exactly like a model that passes none. I have 48 tasks in that neighborhood.
2. A two-test task outranks a hundred-test task. kgateway-consistent-hash-policy has two target tests. Getting it wrong costs the same point as failing a task with 254. If the goal is to measure how much correct behavior a model produces, the ruler is not linear.
3. The score is fragile to things that are not the model. Our local runs and the published numbers disagree about the ordering of these two models. Different weights (mine are 4-bit), a different serving stack, a different harness around the same agent framework. When a metric is a count of all-or-nothing events, a handful of tasks flipping moves the headline by percentage points — and a single task can flip for a reason as boring as a container that could not reach a package registry.
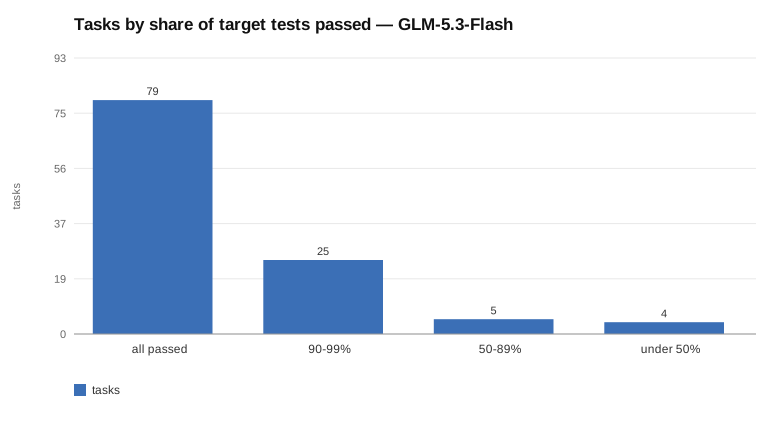
That chart is the one I would put next to the leaderboard number. Seventy-nine tasks all-passed, twenty-five in the 90–99% band, five in 50–89%, four below half. The score says 67.3%. The distribution says “this model is almost always nearly right”.
So just count all the tests, then?
Careful. Counting tests has its own trap, and the same corpus shows it.
The regression suites are extremely concentrated: the five largest tasks hold 75.5% of all 231,352 p2p tests, and one task — expr-try-catch-errors — holds 66,265 of them, 38.7% of the corpus total. If a model broke that single task, our pooled p2p number would fall from 100.00% to about 61%, on the strength of one decision. Pooled p2p is not a measure of anything except a handful of giant test suites in the Go, Python and JavaScript corners of the corpus.
Target tests are better behaved (the top five f2p tasks hold 14% of the mass) but still uneven: pooling them means a 254-assertion task counts 127 times more than a 2-assertion one. That is at least honest weighting — it measures behavior covered, which is what it claims to measure — but it is a different question from “how many of these 113 tasks can the model finish”.
What I would report instead
Reporting one number for a 113-task benchmark is a design choice, and the choice being made today is the harshest available. If I were presenting these runs, I would show four cheap things that the harness already records:
- Pass@1 — the binary score, unchanged. It answers “did it ship”, and sometimes that is the only question.
- Mean target-test coverage per task —
mean(f2p_passed / f2p_total). It answers “how close is a typical attempt”, and it is the number where GLM’s advantage over MiMo is largest (94.7% against 90.6%). - The band distribution — all-passed / 90–99% / 50–89% / under 50%. It is one chart, it costs nothing, and it exposes exactly what the pass rate hides.
- Regression failures as a count, per task — “broke existing behavior on 5 tasks”, not a pooled percentage that five giant suites dominate.
None of this replaces the binary metric. It contextualizes it. A model with 67% Pass@1 and 25 near-misses is a different instrument from a model with 67% Pass@1 and 25 catastrophic failures, and a reader choosing a model deserves to know which one they are looking at.
The honest counter-argument
Partial credit can flatter a patch that is wrong where it matters. A change that passes 253 of 254 target tests may be failing precisely the assertion that encodes the security check, or the edge case the whole task was written to test. The corpus authors chose all-or-nothing because “mostly working” is not a category you can ship, and on that basis the metric is doing what it says.
My claim is narrower than “the metric is wrong”. It is that the metric is incomplete as a headline — it collapses a graded outcome into a coin flip per task, it ignores how much behavior each task contains, and it makes the published ranking sensitive to configuration details that no reader can see. The information needed to fix that is already being collected by the harness; it just is not being shown.
What this does not prove
- 113 tasks, one run each. The confidence intervals are wide (76/113 gives [58.2, 75.2]) and I have not done repetitions.
- My local runs use quantized weights on consumer cards. The published numbers come from other configurations entirely, and part of what I am calling “fragility” could just be my quantization.
- Test counts are a proxy for behavior, not a measure of importance. A two-assertion task can encode the only thing that matters.
- Two models is not a trend. I have four models on the five Rust tasks and two on the full corpus; the pattern is consistent, but it is two data points.
Reproducibility
Every number above comes from the run records: one JSON file per batch, one entry per trial, with the f2p and p2p tallies the verifier produced. The audit that checks the verifier logs for environment failures (and that caught a false 0/62 in a different model’s run) is a grep over those logs. The charts are generated from the same records.