Qwen3.8-27B-FP8: First Benchmarks on RTX PRO 6000 Blackwell
Qwen3.8 is out, and it’s a dense 27B that Qwen positions as the most capable generation in its open-model family. Before I commit my RTX PRO 6000 Blackwell to it, I’m running a four-part test: quality (this post), quantization (FP8 vs. NVFP4), long context (the 1M token claim), and thinking depth (the four reasoning levels). This is the first data point: the FP8 variant on BenchLocal.app, run twice — once with a conservative sampling (temperature 0.6) and once with the model’s official sampling (temperature 1.0) — against my Qwen3.6-27B-FP8 numbers (run at 0.6) as the reference.
Why two passes? Because the model card and the vLLM recipe both prescribe temperature 1.0 for thinking mode, while my Qwen3.6 deployment ran at 0.6. Comparing a generation jump and a sampling change in the same table would tell you nothing, so both get their own column.
The Model
Qwen3.8-27B is a dense 27B vision-language model built on the Qwen3.5 architectural foundation. The interesting part is the hybrid attention layout: 16 blocks of 3 × (Gated DeltaNet → FFN) → 1 × (Gated Attention → FFN) — linear attention doing the heavy lifting, with full attention every fourth layer. It ships with MTP (multi-token prediction) trained with multiple steps, thinking mode on by default with per-request control, and a context window of 262,144 tokens natively, extensible up to 1,000,000 — the 1M number I want to stress-test in part three.
The official model card claims these results (text benchmarks, post-trained):
| Benchmark | Qwen3.8-27B | Qwen3.6-27B | Qwen3.7-Plus |
|---|---|---|---|
| Terminal Bench 2.1 (Terminus) | 73.0 | 63.4 | 64.0 |
| SWE-bench Pro | 61.7 | 53.5 | 57.6 |
| NL2Repo-Bench | 42.3 | 36.2 | 41.1 |
| DeepSWE 1.1 | 42.2 | 13.3 | 14.2 |
| QwenSWEBench | 79.0 | 49.3 | 59.2 |
| CoWorkBench | 70.7 | 61.0 | 65.1 |
That’s a substantial generational jump on the card — DeepSWE tripling, QwenSWEBench up 30 points. The question, as always, is what survives contact with a local deployment.
BenchLocal Results: Qwen3.8-27B-FP8 @ temperature 0.6
All runs: 1x, parallel per test case, RTX PRO 6000 Blackwell, August 14, 2026. This pass uses the conservative sampling from my previous Qwen3.6 deployment, which makes it directly comparable to the reference column.
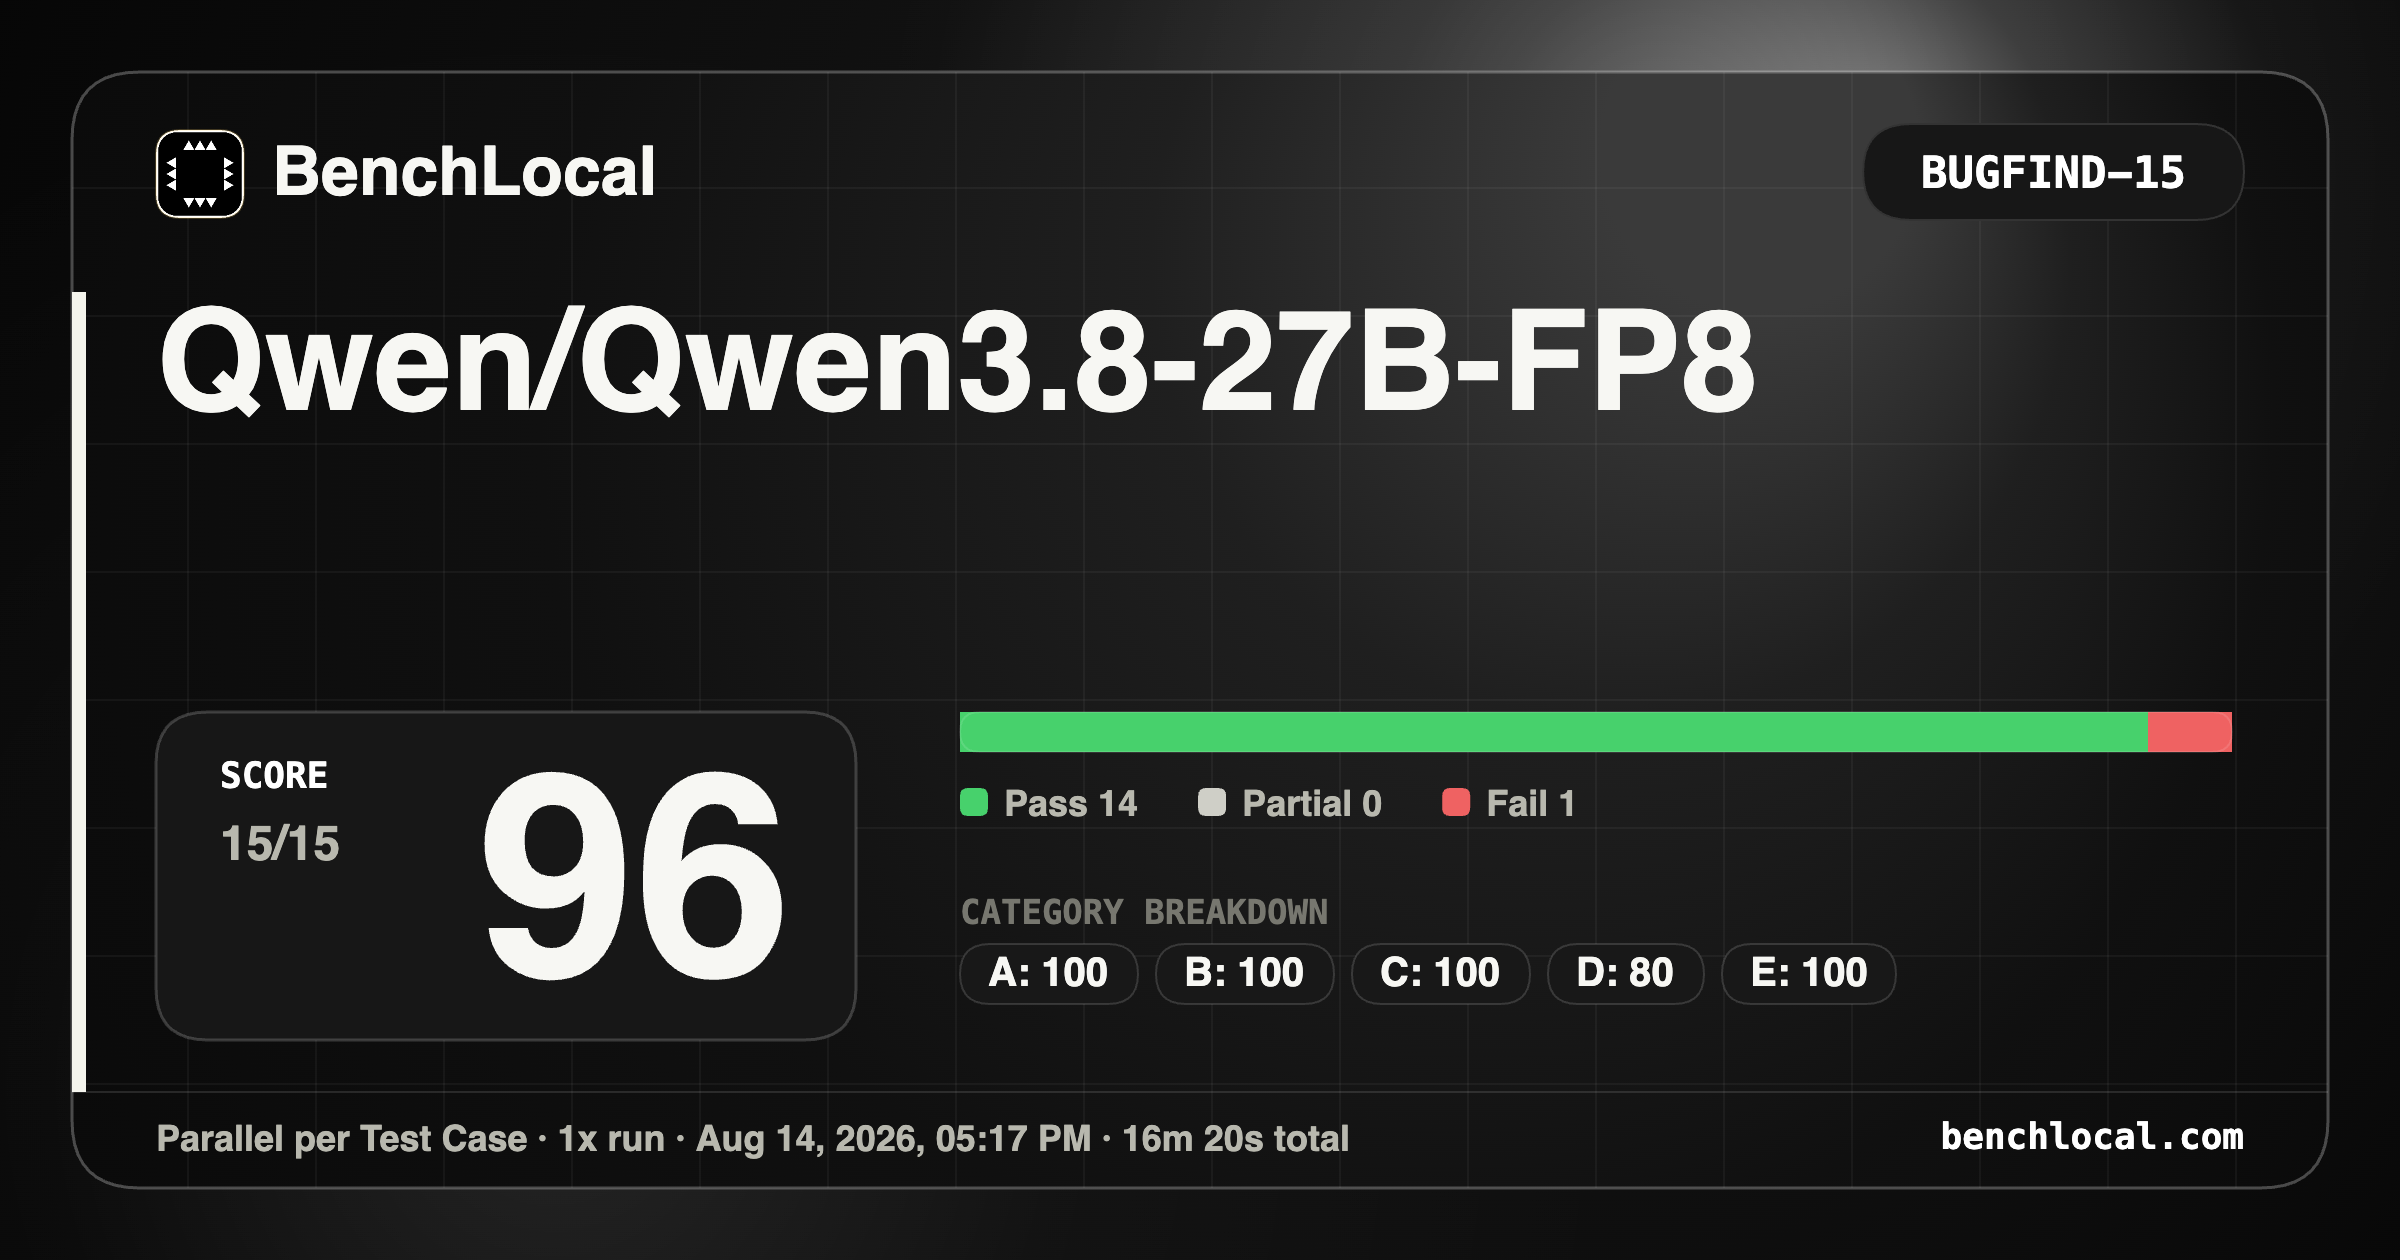
BugFind-15
| BenchLocal | |
|---|---|
| Score: 96 | A: 100 |
| Pass: 14 | B: 100 |
| Partial: 0 | C: 100 |
| Fail: 1 | D: 80 |
| E: 100 |
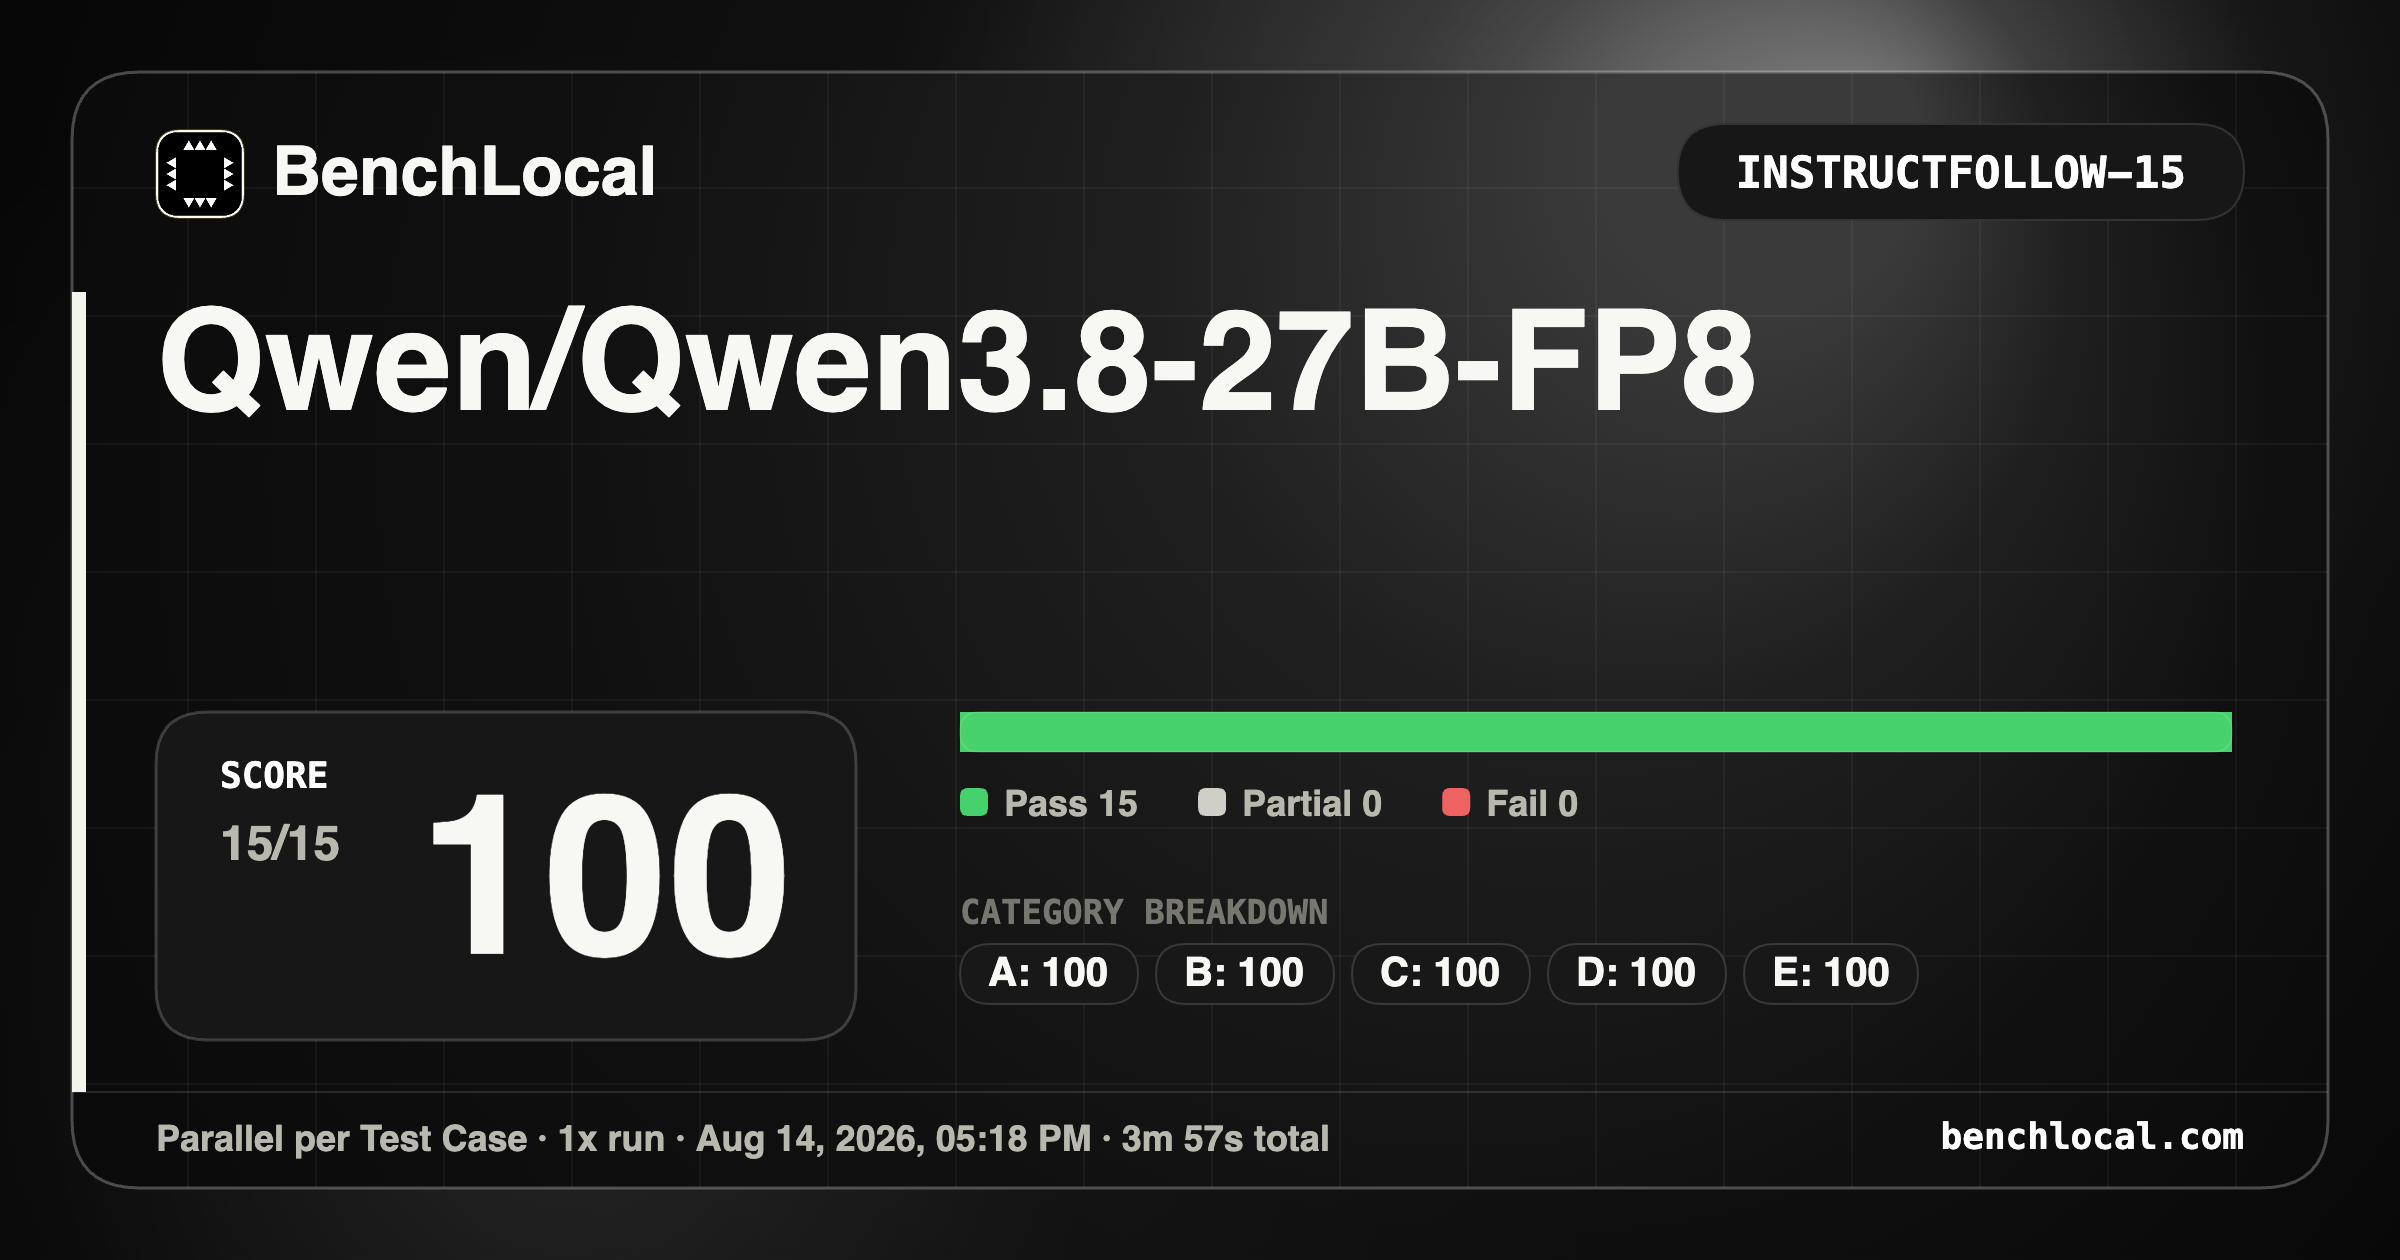
InstrucFollow-15
| BenchLocal | |
|---|---|
| Score: 100 | A: 100 |
| Pass: 15 | B: 100 |
| Partial: 0 | C: 100 |
| Fail: 0 | D: 100 |
| E: 100 |
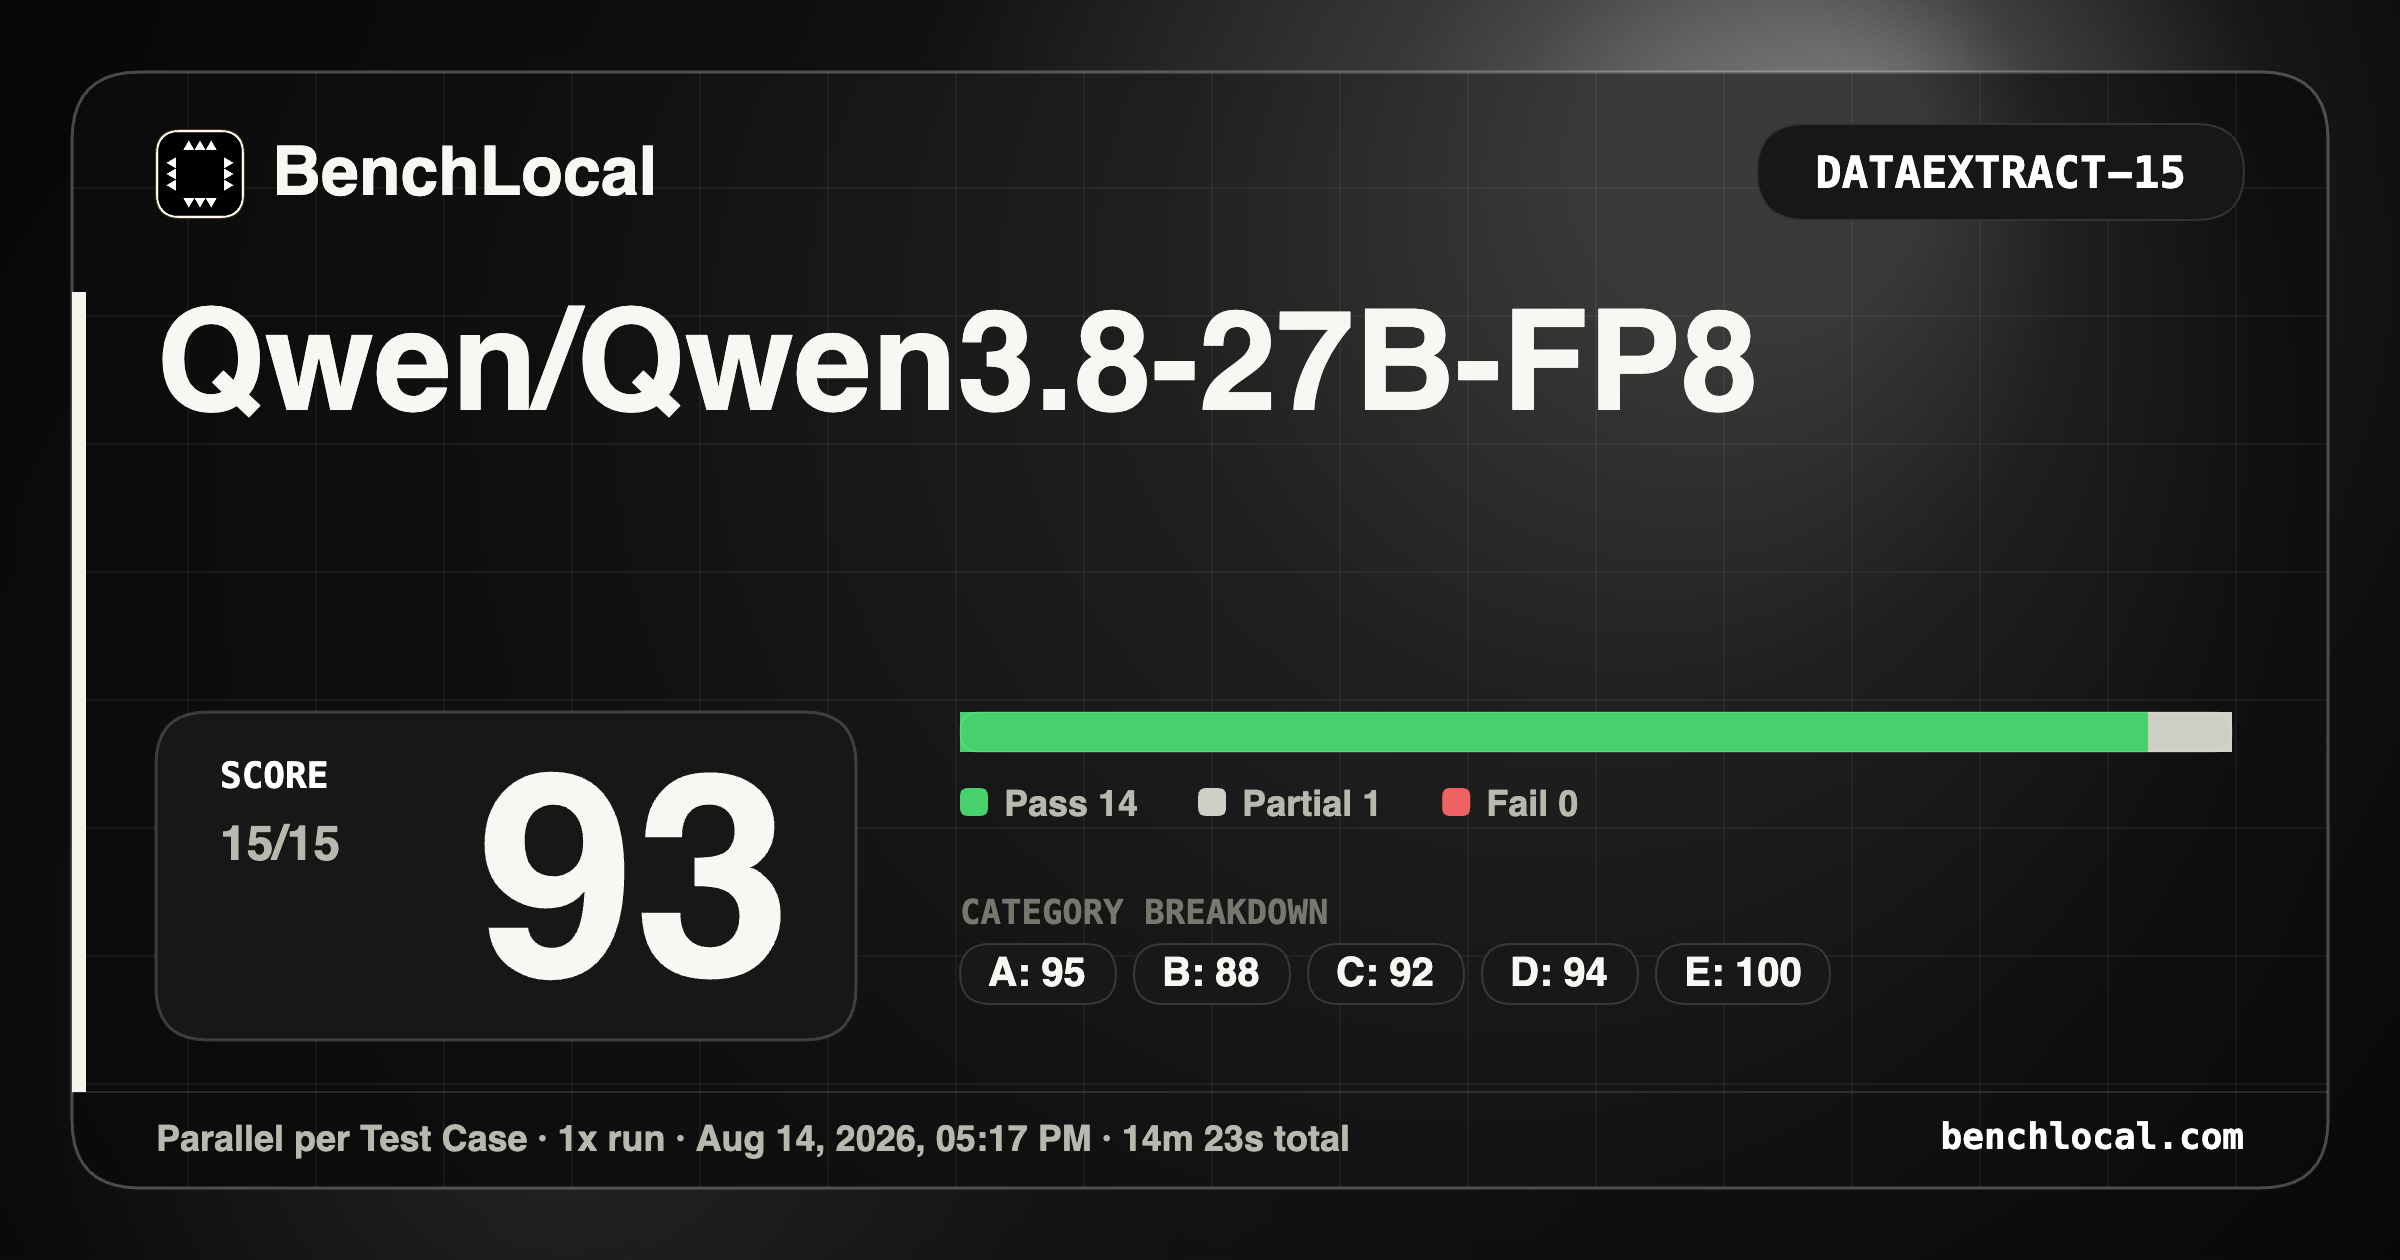
DataExtract-15
| BenchLocal | |
|---|---|
| Score: 93 | A: 95 |
| Pass: 14 | B: 88 |
| Partial: 1 | C: 92 |
| Fail: 0 | D: 94 |
| E: 100 |
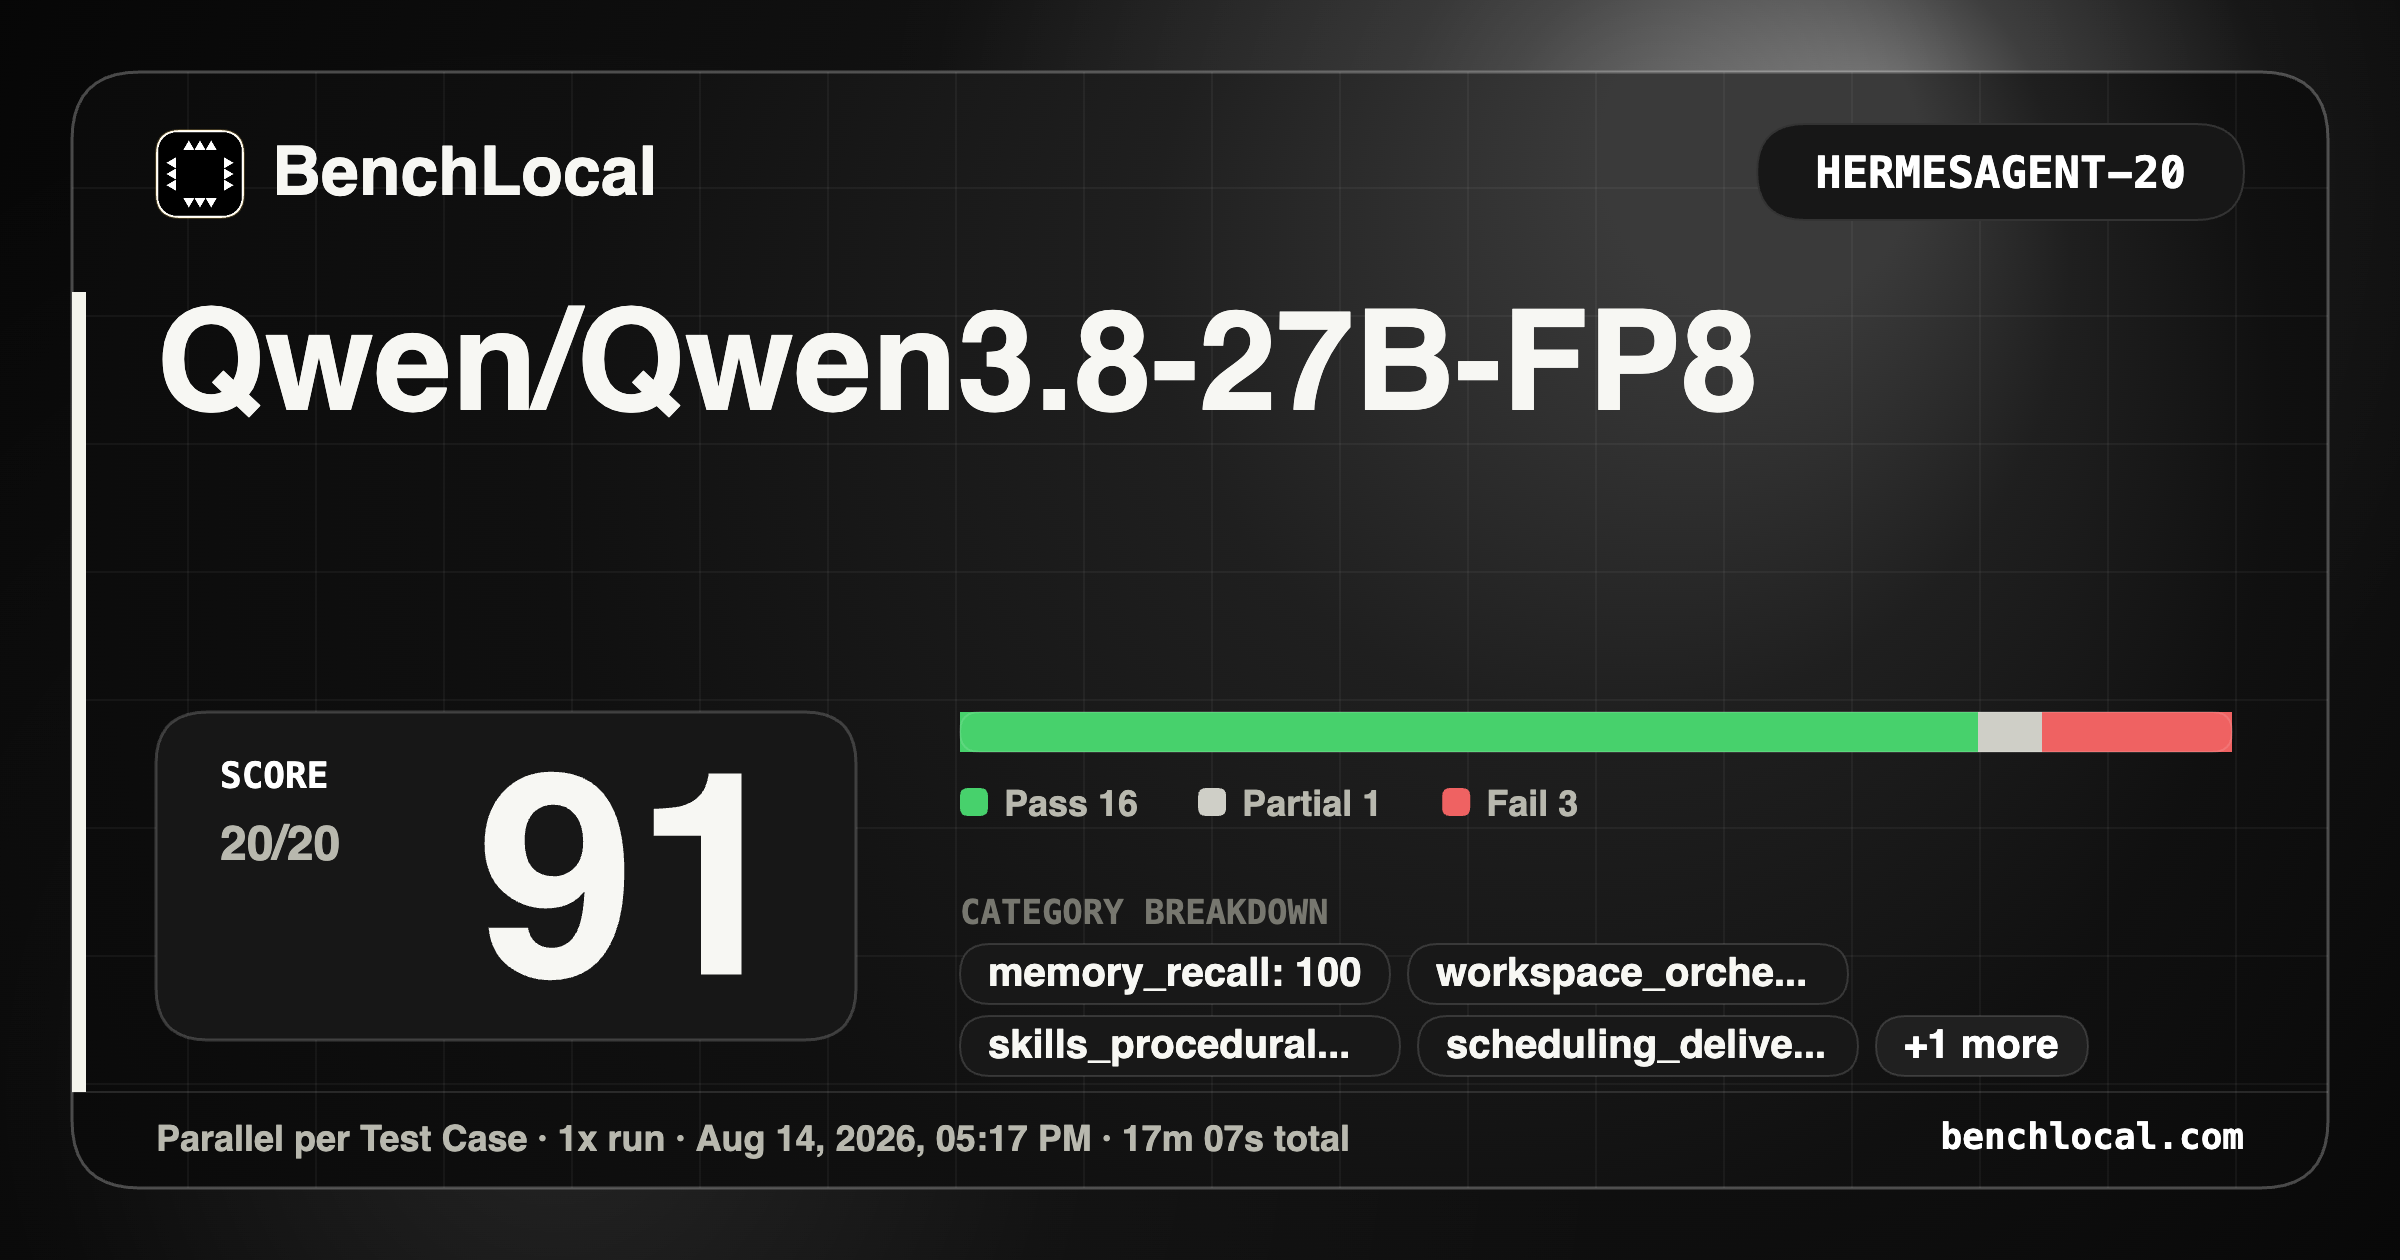
HermesAgent-20
| BenchLocal | |
|---|---|
| Score: 91 | memory_recall: 100 |
| Pass: 16 | workspace_orche…: — |
| Partial: 1 | skills_procedural…: — |
| Fail: 3 | scheduling_delive…: — |
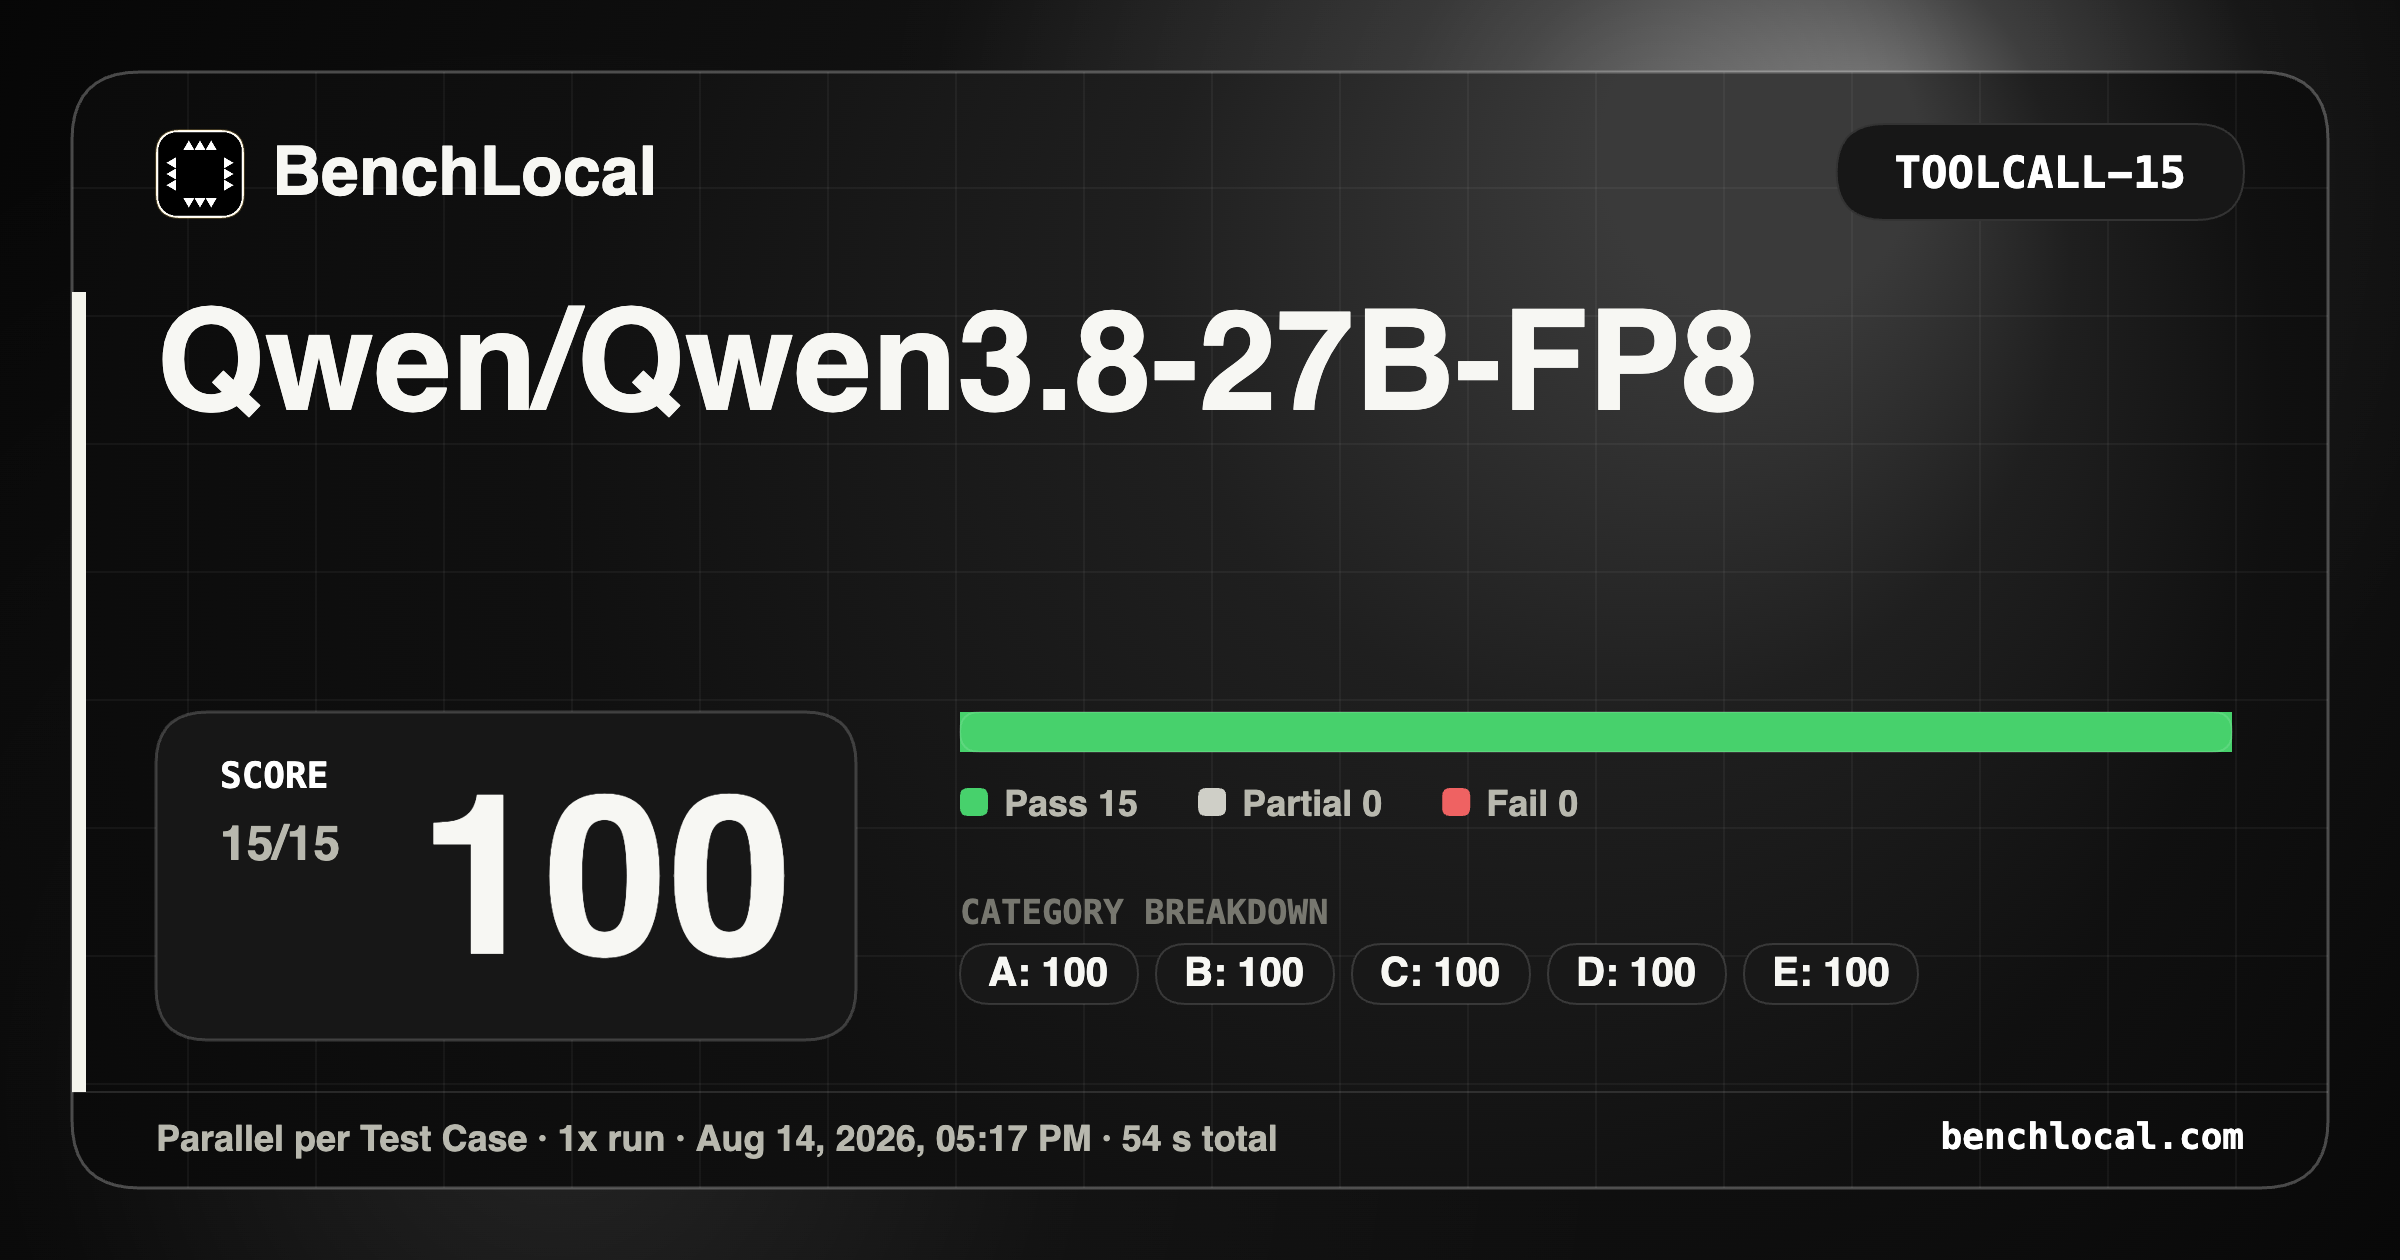
ToolCall-15
| BenchLocal | |
|---|---|
| Score: 100 | A: 100 |
| Pass: 15 | B: 100 |
| Partial: 0 | C: 100 |
| Fail: 0 | D: 100 |
| E: 100 |
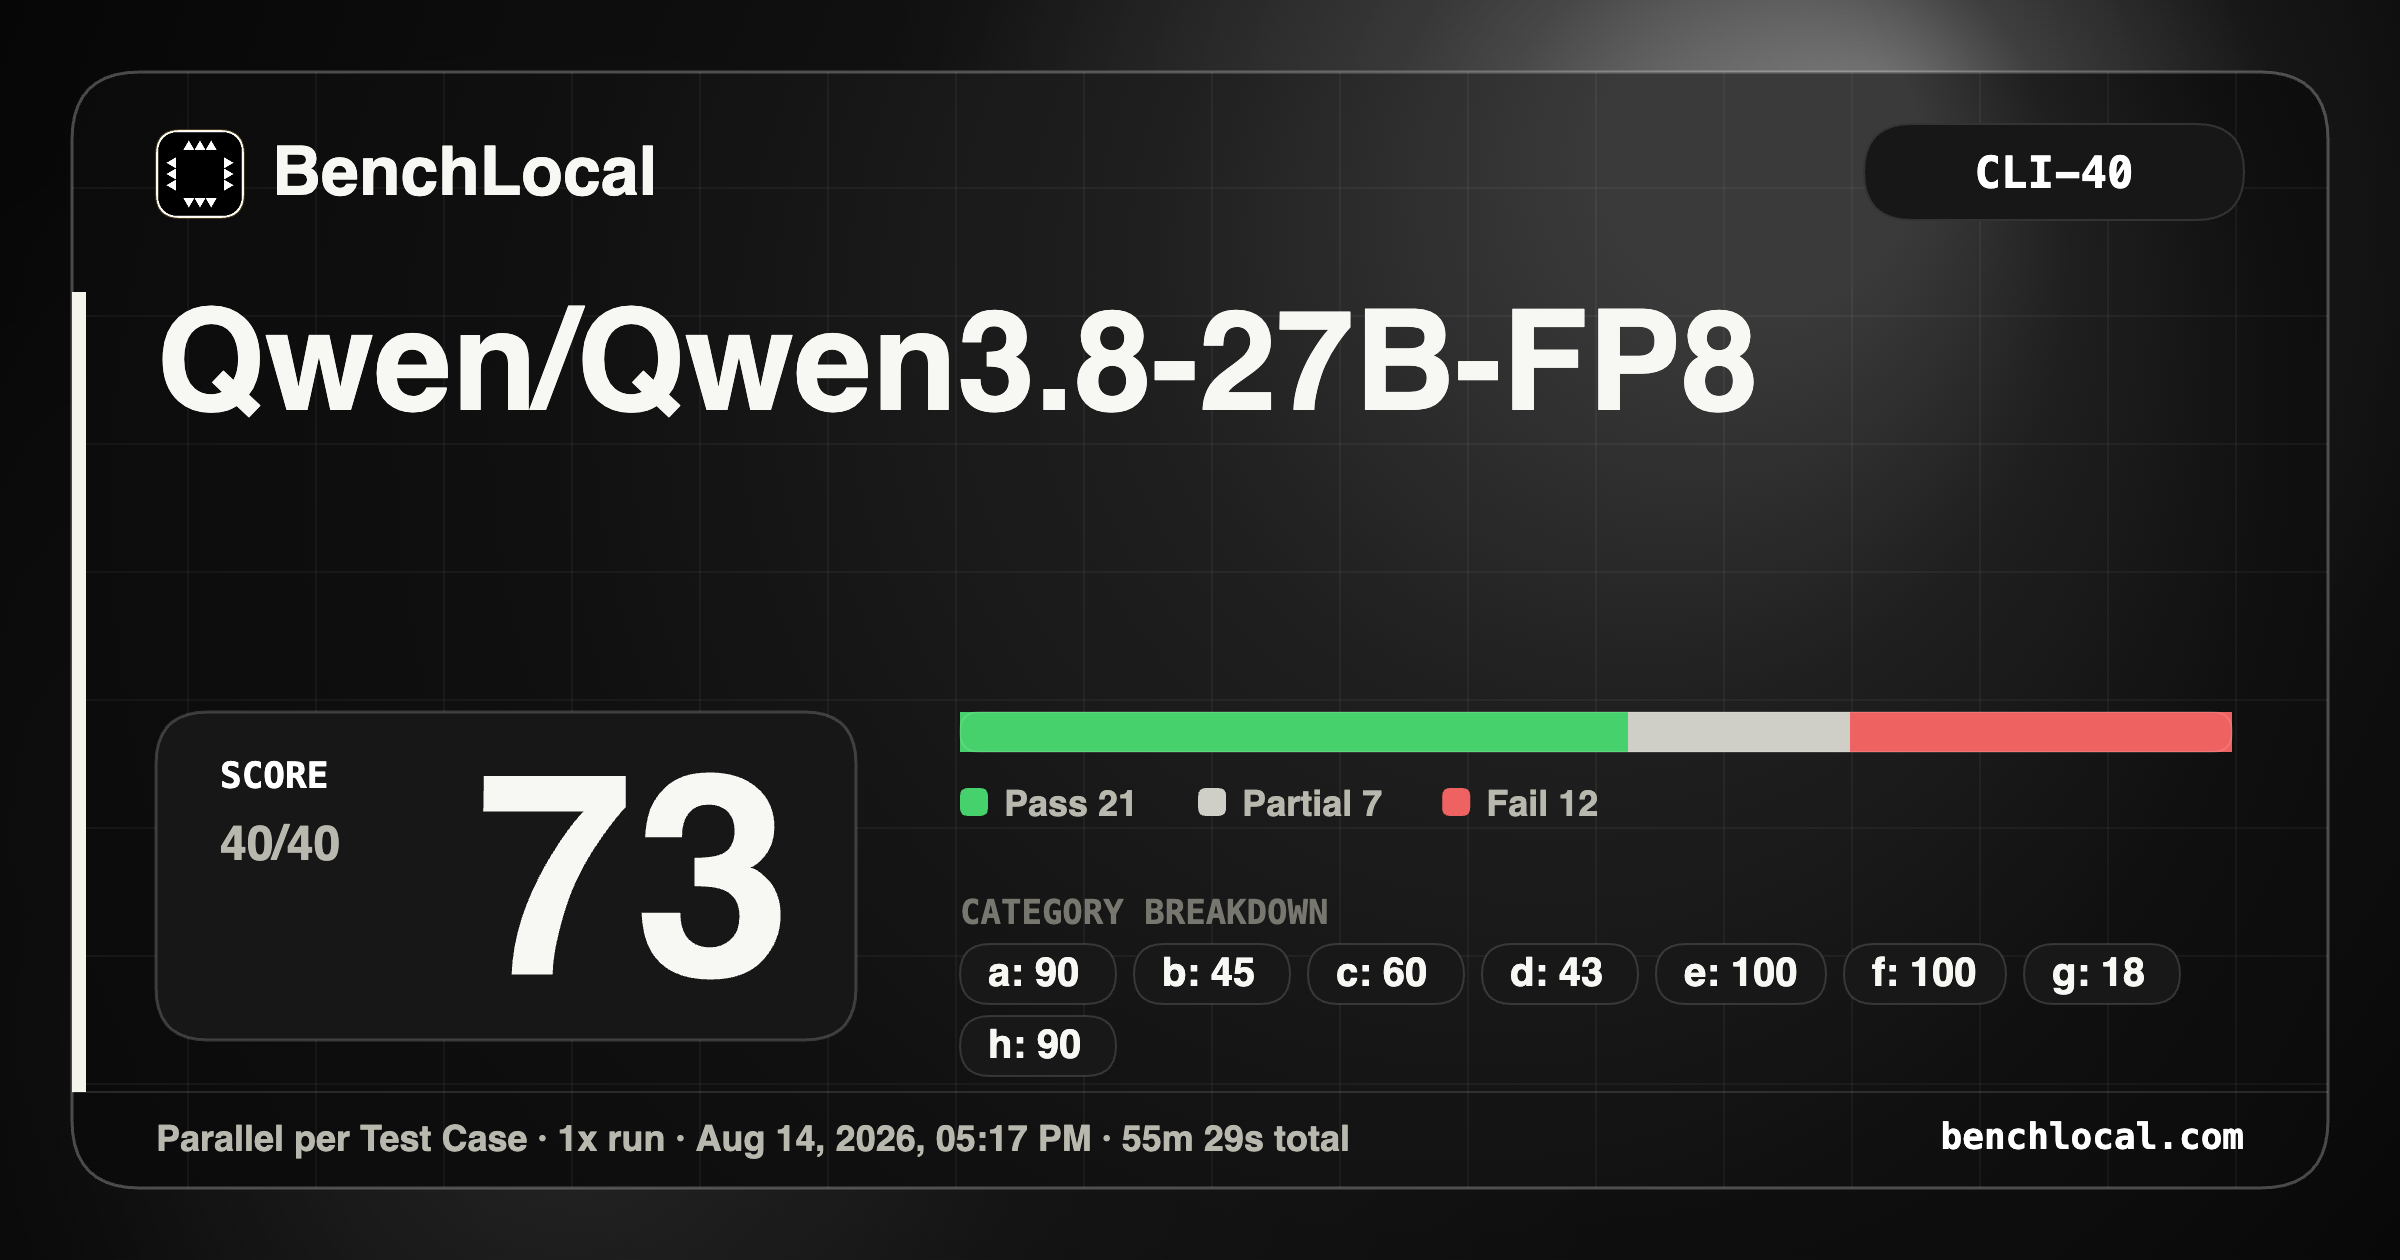
CLI-40
| BenchLocal | |
|---|---|
| Score: 73 | a: 90 |
| Pass: 21 | b: 45 |
| Partial: 7 | c: 60 |
| Fail: 12 | d: 43 |
| e: 100 | |
| f: 100 | |
| g: 18 | |
| h: 90 |
BenchLocal Results: Qwen3.8-27B-FP8 @ temperature 1.0 (official sampling)
Same model, same hardware, same suite — only the sampling changed, per the model card’s thinking-mode recommendation (temperature 1.0, top_p 0.95, top_k 20). This pass ran each case 3x (vs. 1x at 0.6), so the numbers are more stable. CLI-40 was stopped mid-run: it was both the slowest suite and the one degrading the most at this sampling, so it is not included here.
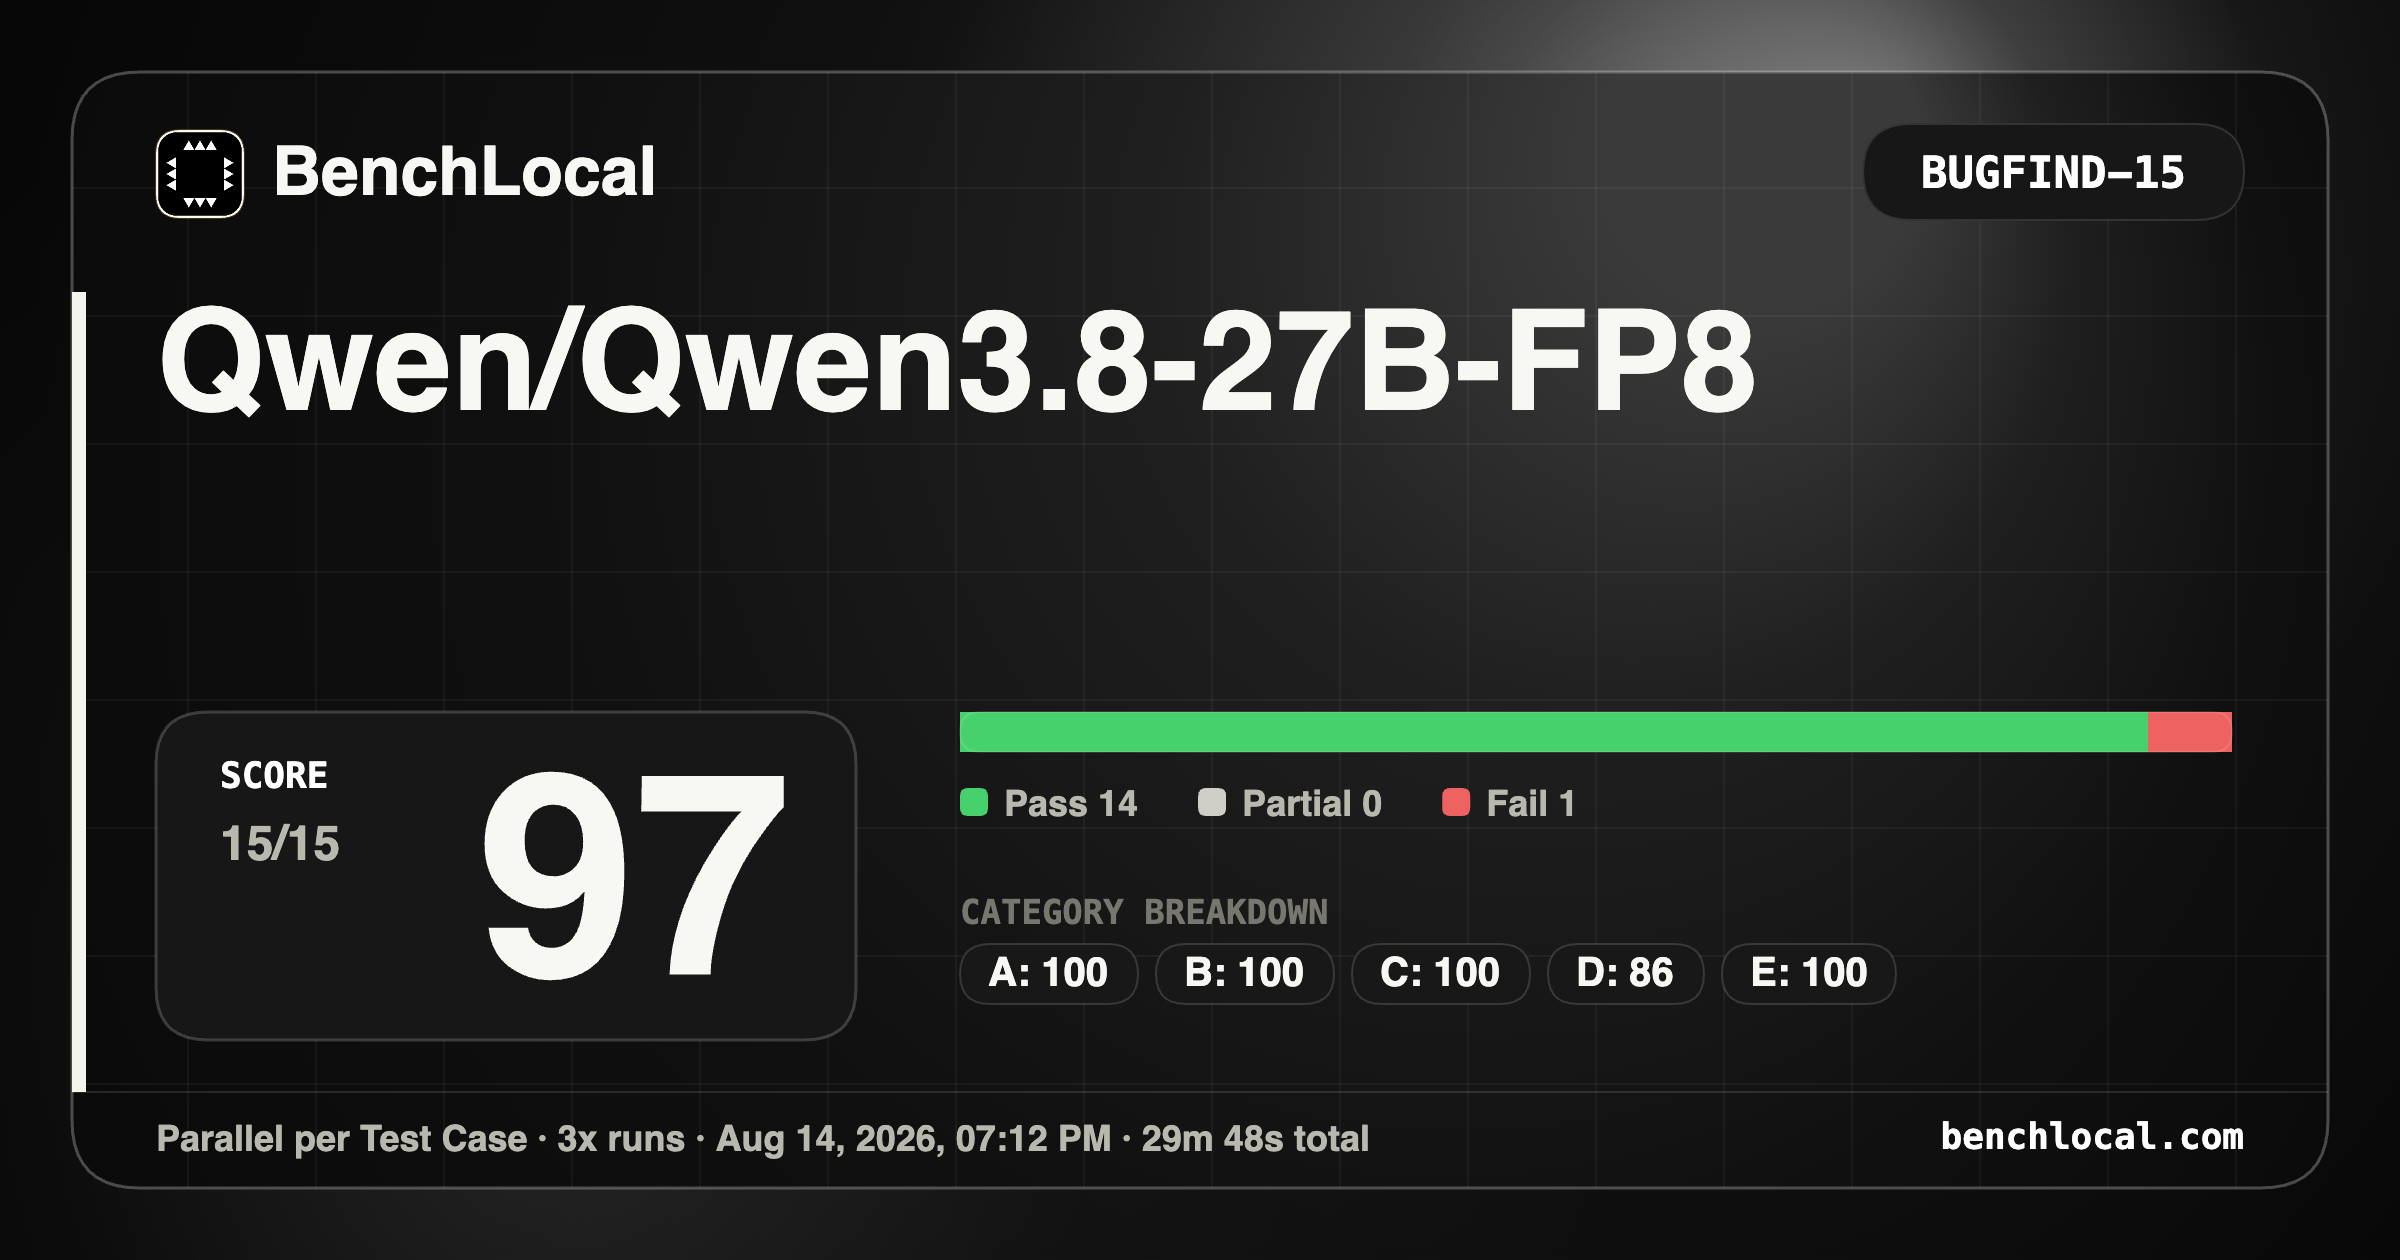
BugFind-15
| BenchLocal | |
|---|---|
| Score: 97 | A: 100 |
| Pass: 14 | B: 100 |
| Partial: 0 | C: 100 |
| Fail: 1 | D: 86 |
| E: 100 |
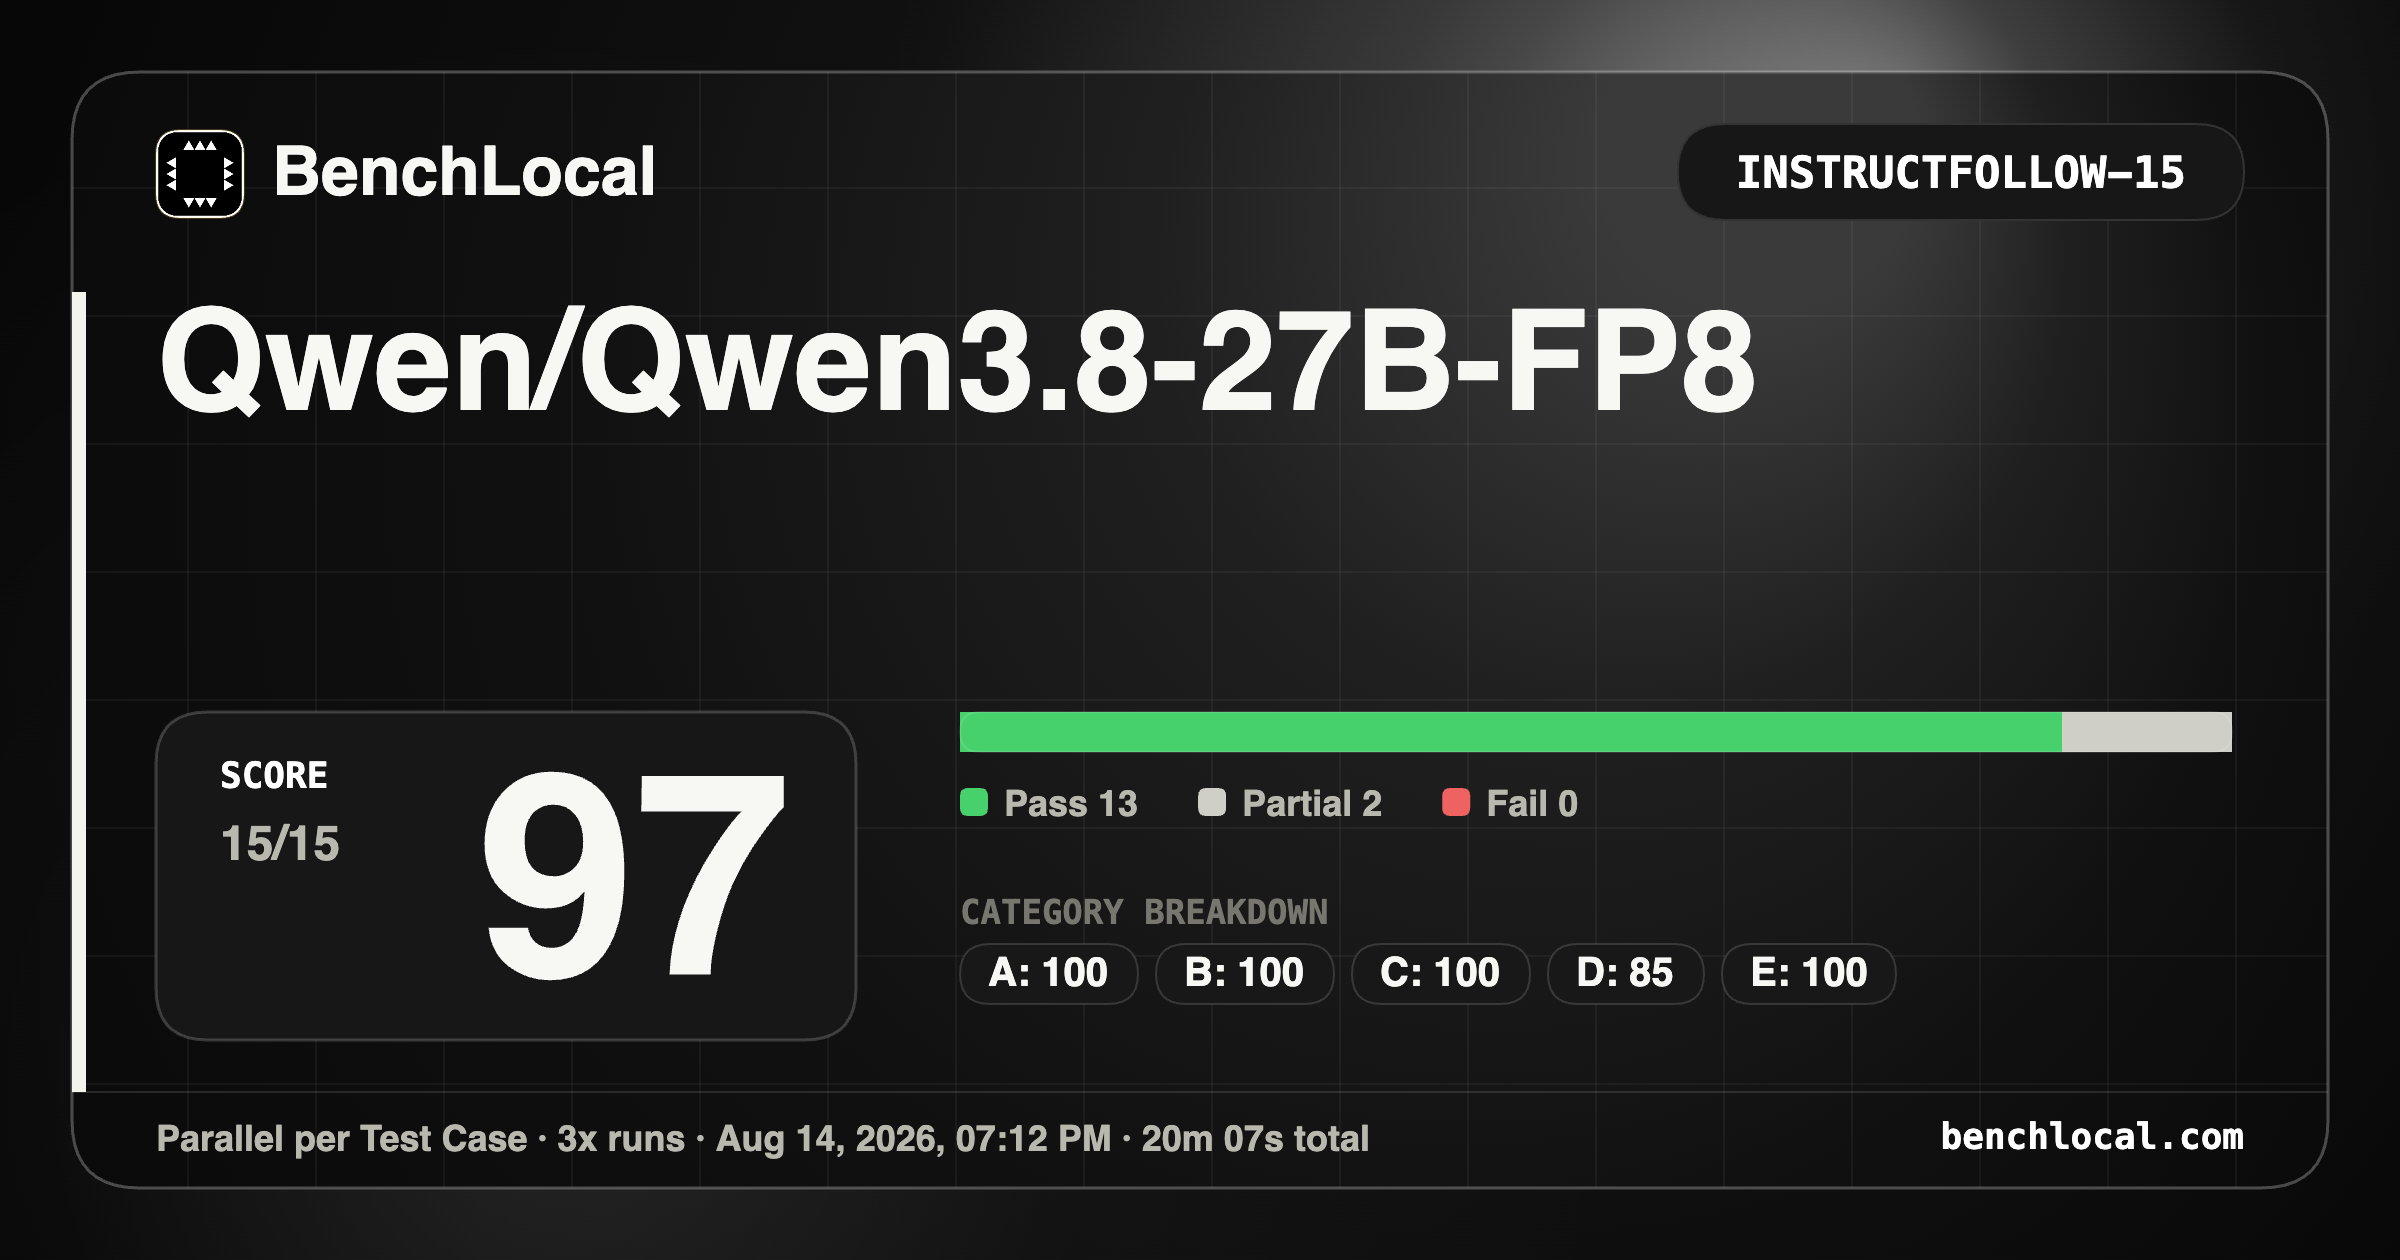
InstrucFollow-15
| BenchLocal | |
|---|---|
| Score: 97 | A: 100 |
| Pass: 13 | B: 100 |
| Partial: 2 | C: 100 |
| Fail: 0 | D: 85 |
| E: 100 |
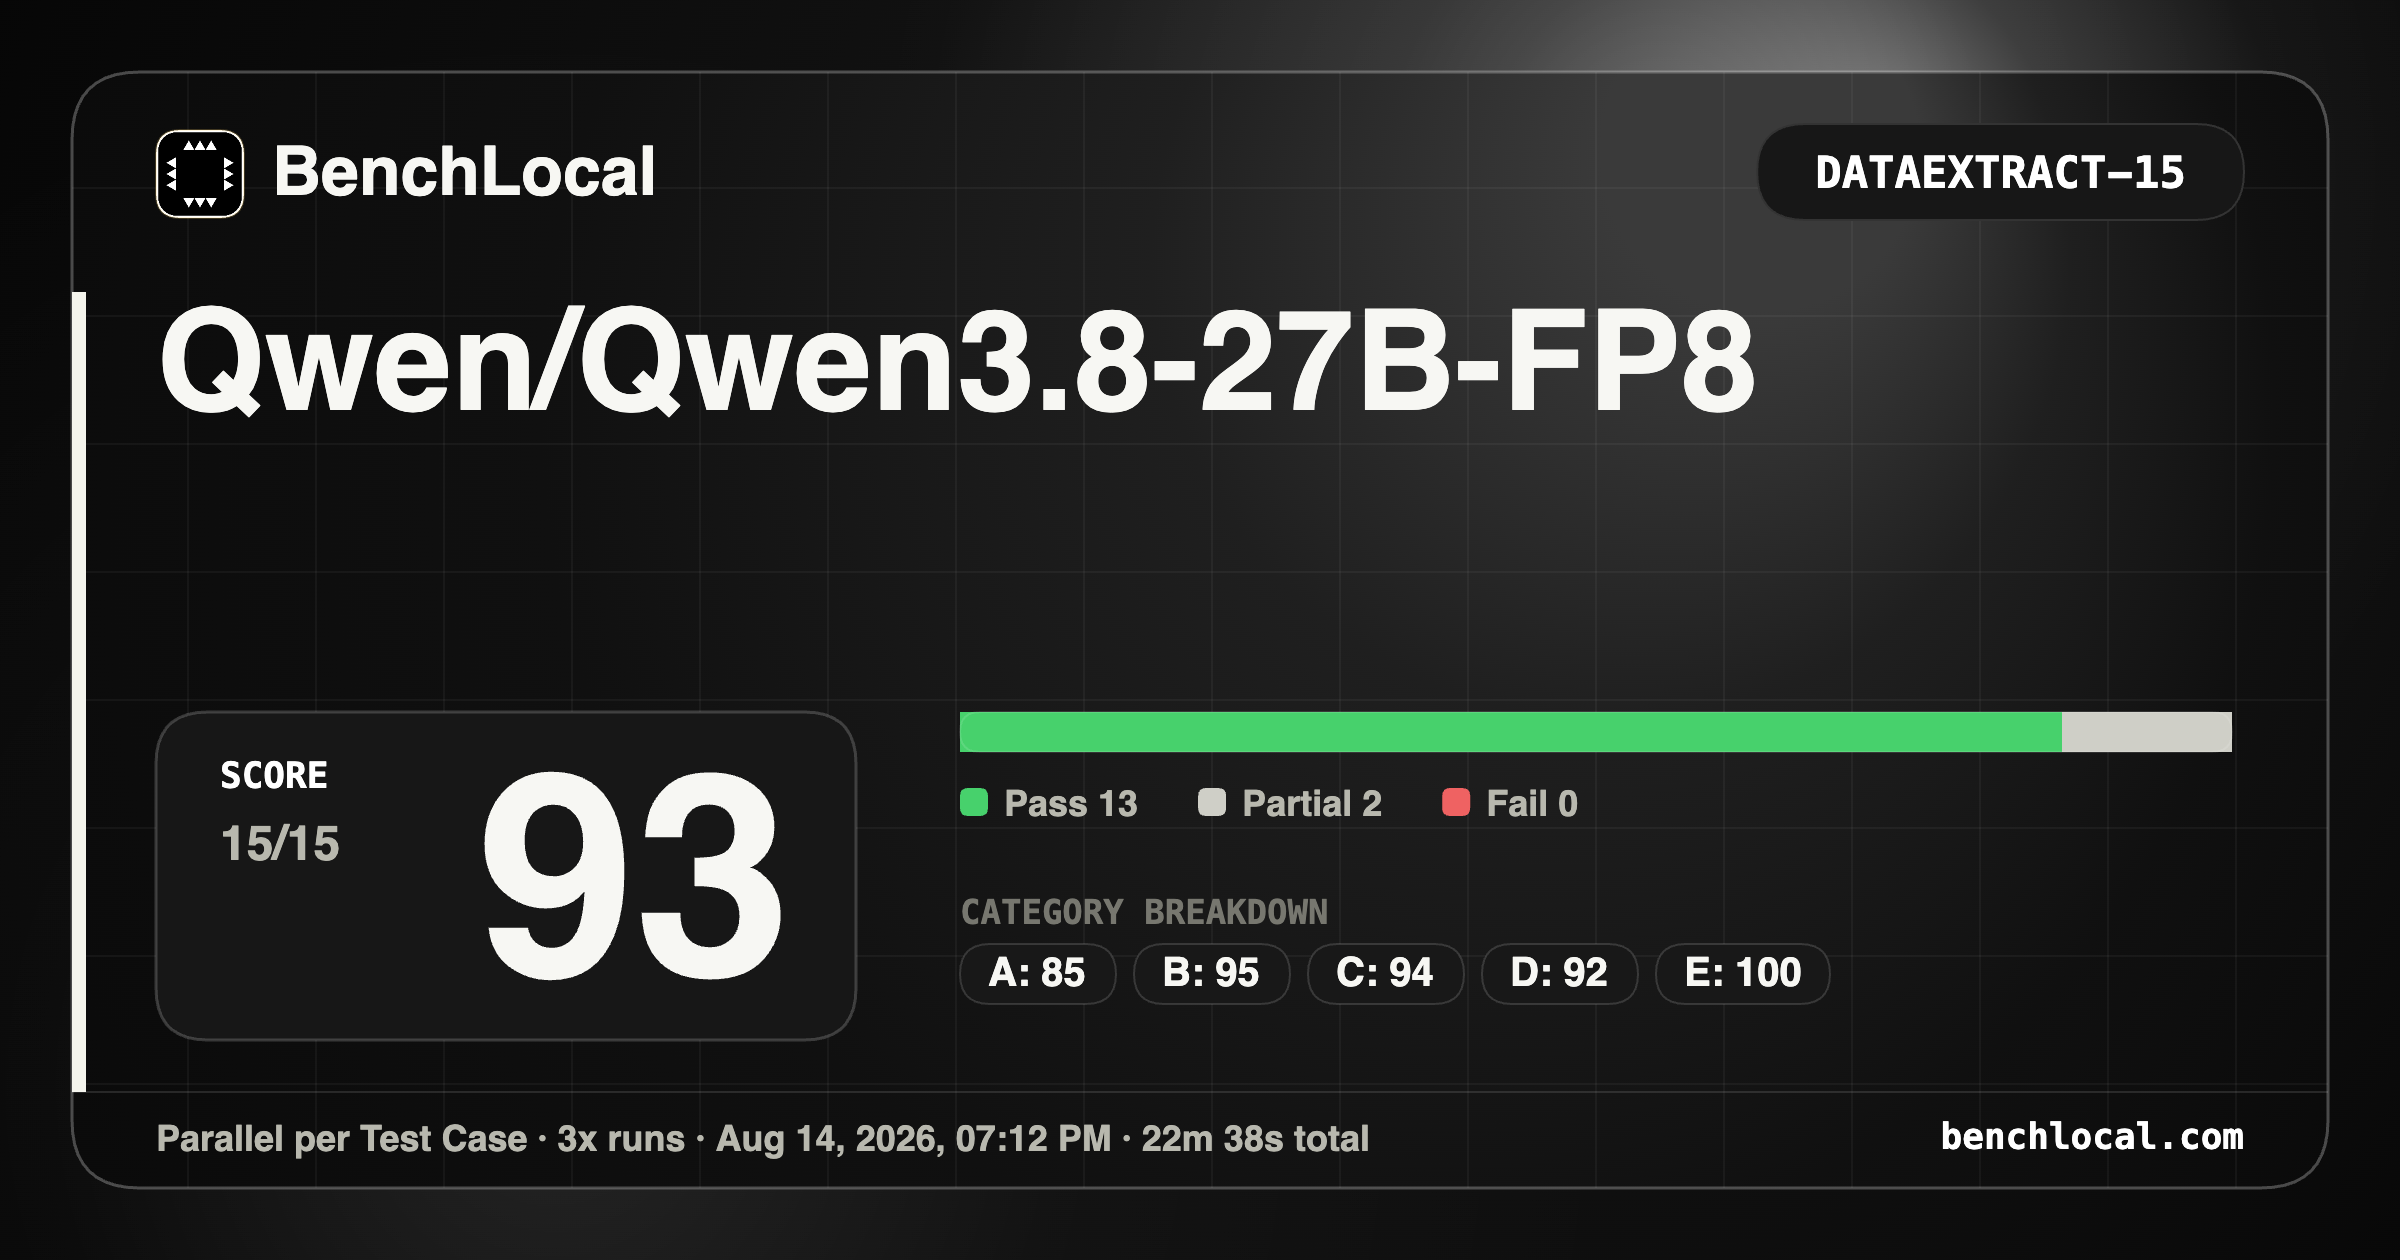
DataExtract-15
| BenchLocal | |
|---|---|
| Score: 93 | A: 85 |
| Pass: 13 | B: 95 |
| Partial: 2 | C: 94 |
| Fail: 0 | D: 92 |
| E: 100 |
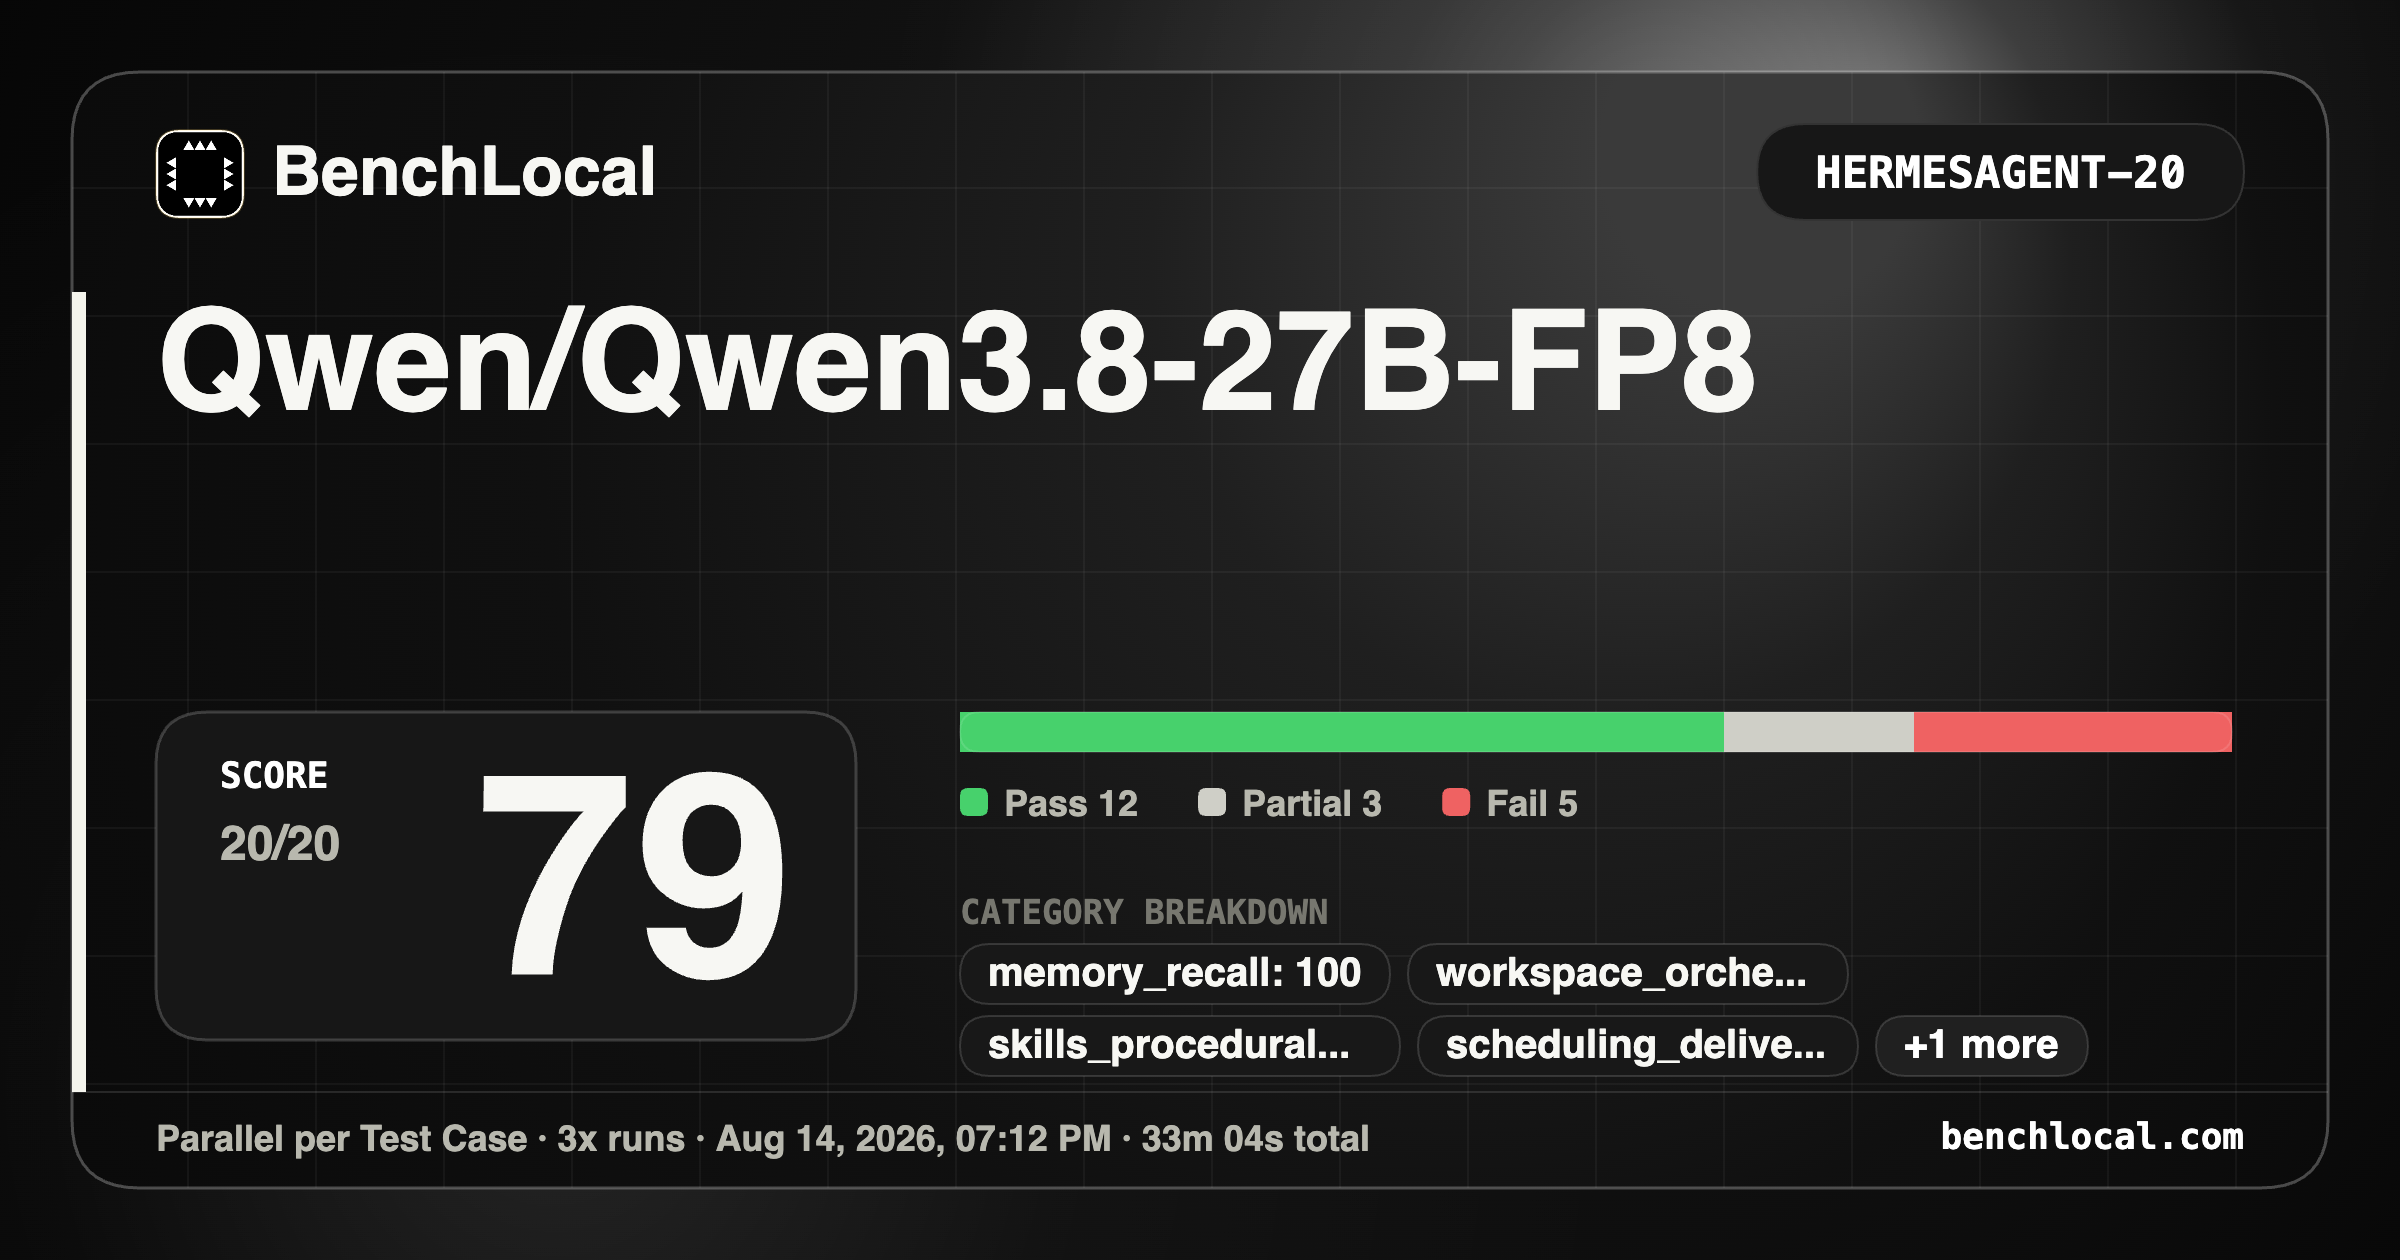
HermesAgent-20
| BenchLocal | |
|---|---|
| Score: 79 | memory_recall: 100 |
| Pass: 12 | workspace_orche…: — |
| Partial: 3 | skills_procedural…: — |
| Fail: 5 | scheduling_delive…: — |
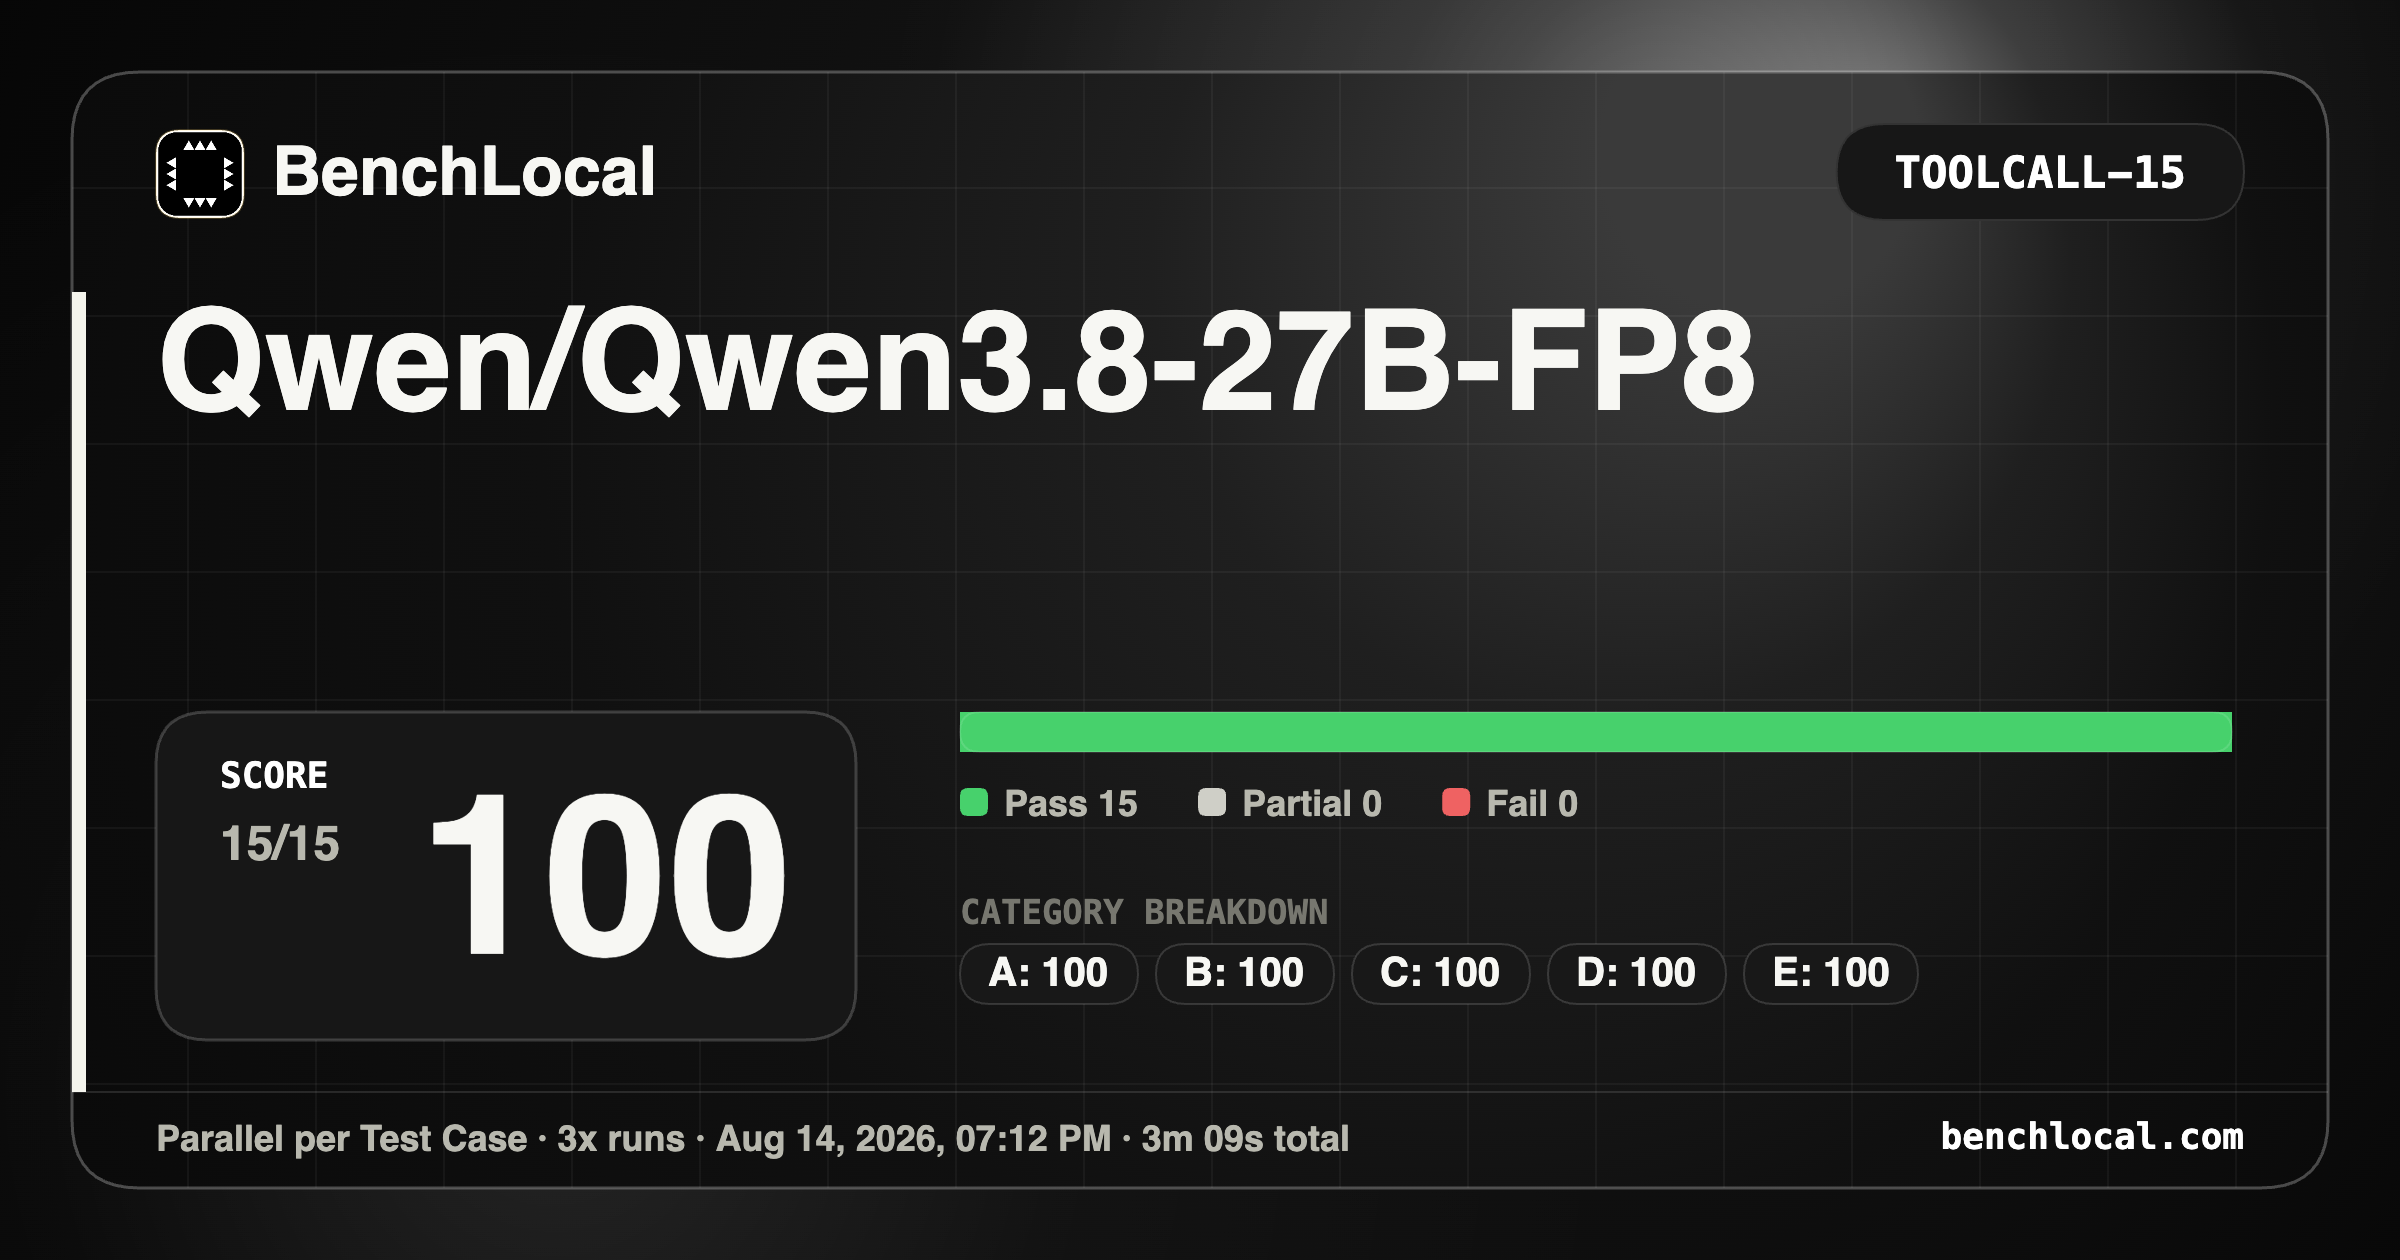
ToolCall-15
| BenchLocal | |
|---|---|
| Score: 100 | A: 100 |
| Pass: 15 | B: 100 |
| Partial: 0 | C: 100 |
| Fail: 0 | D: 100 |
| E: 100 |
CLI-40
Stopped mid-run. At temperature 1.0 this suite was the slowest and the most failure-prone of the six — long, stateful CLI sessions where an exploratory token on any of the 40 steps can derail the case, and the 3x repetition multiplies the wall-clock. Excluded from the comparison until a dedicated run.
Comparison: three columns
Same hardware (RTX PRO 6000 Blackwell), same FP8 precision, same BenchLocal suite. Two variables isolated: the generation (3.6 → 3.8) and the sampling (0.6 → 1.0). The full Qwen3.6 run is in the Qwen3.6 benchmarks post.
| Benchmark | Qwen3.8 @ 0.6 | Qwen3.8 @ 1.0 | Qwen3.6 @ 0.6 |
|---|---|---|---|
| BugFind | 96 | 97 | 90 |
| InstrucFollow | 100 | 97 | 97 |
| DataExtract | 93 | 93 | 85 |
| HermesAgent | 91 | 79 | 62 |
| ToolCall | 100 | 100 | 97 |
| CLI-40 | 73 | stopped | N/A |
| Average (5 shared) | 96.4 | 93.2 | 86.2 |
Reading the table two ways:
- Generation effect (3.8 @ 0.6 vs. 3.6 @ 0.6, the apples-to-apples column): Qwen3.8 wins every shared suite, most decisively on HermesAgent (62 → 91). That’s the generational jump, and it’s large.
- Sampling effect (3.8 @ 0.6 vs. 3.8 @ 1.0, the same model two ways): the official thinking-mode sampling costs on average, but the cost is not uniform. BugFind and ToolCall hold (96→97, 100→100), DataExtract is flat (93), InstrucFollow dips slightly (100→97), and HermesAgent drops the most (91 → 79) — exactly where a binary per-case agentic benchmark punishes a single exploratory detour. The takeaway: for deterministic, tool-heavy agent work, the conservative sampling is the better calibration; the model’s own default is optimized for open-ended generation, not for grading 20 tool-call steps.
Where it still stumbles
Two honest caveats.
CLI-40 is the weak spot and it’s sampling-sensitive. At 0.6 it scored 73 (category g at 18, d at 43, while e and f sat at 100) — a wide spread where the model is excellent at some CLI workflows and visibly weak at others. At 1.0 it was the suite I stopped: slowest and most failure-prone, because long stateful CLI sessions amplify every exploratory detour. CLI is where this generation’s gains are least visible.
The sampling is a real dial, not a footnote. The official 1.0 thinking-mode sampling is what the model ships with, and it’s what the recipe prescribes — but on a binary, tool-heavy agentic benchmark it costs HermesAgent 12 points (91 → 79) while leaving the deterministic suites (BugFind, ToolCall) untouched. The model’s default is tuned for open-ended generation; an agent that must not drop a tool call over 20 steps is better served by the conservative 0.6. That’s a calibration choice, not a model defect — and it’s a number no model card will give you, because nobody runs the same suite twice.
What’s next
This is part one of four:
- Quality (this post) — FP8, the reference run, at two samplings (0.6 vs. the official 1.0).
- Quantization — FP8 vs. NVFP4. Skeleton, to be revised before publishing:
-
Context: what the vendor measured. Unsloth publishes KLD and top-1 agreement for its Dynamic V3.0 NVFP4 against BF16 (not FP8), per corpus:
Corpus KLD mean Top-1 agreement zh 0.01628 93.55% code 0.02600 96.68% refgen 0.03993 94.46% chat 0.05818 92.15% ja/ko/ru/es 0.0124–0.0155 94–95% Note: these numbers are vs. BF16, so they don’t directly answer “NVFP4 vs. FP8”. FP8’s own KLD is not published anywhere — treat this table as vendor context, not as the verdict.
-
The verdict: BenchLocal. Both quants at
temperature 0.6, same hardware, same suite (NVFP4 at 3x per case except CLI-40 at 1x, matching the FP8 pass):Benchmark FP8 @ 0.6 NVFP4 @ 0.6 Δ BugFind 96 100 +4 InstrucFollow 100 98 −2 DataExtract 93 94 +1 HermesAgent 91 91 0 ToolCall 100 100 0 CLI-40 73 72 −1 Average (5 shared) 96.4 96.6 +0.2 Headline: NVFP4 is free. The 4-bit quant matches the 8-bit one within run-to-run noise on every suite — HermesAgent and ToolCall at exact parity, CLI-40 (the weak suite) within 1 point, and the average 0.2 points higher. The prediction held: no measurable quality cost from 4-bit on this architecture for agentic work.
-
The practical case for NVFP4: ~24.6 GB weights (vs. ~28 GB FP8) → more KV cache headroom for the 1M part; faster decode (less memory bandwidth); and the scores above say the quality cost is zero.
-
-
Long context — the 1M token claim, on the YaRN 4.0 build (
vllm-qwen-dense-nvfp4-1m). Clean comparison: both builds attemperature 0.6, machine up for the whole run, so the only variable is the context ceiling (262K vs. 1M via YaRN factor 4.0).Suite 262K @ 0.6 1M @ 0.6 Δ quality 262K time 1M time BugFind 100 88 −12 21m 29s 28m 13s InstrucFollow 98 98 0 5m 56s 9m 03s DataExtract 94 93 −1 13m 17s 19m 52s HermesAgent 91 87 −4 27m 37s 37m 04s ToolCall 100 100 0 2m 08s 2m 04s CLI-40 72 70 −2 44m 52s 52m 10s - Quality: YaRN is not free on the hard suites. The model card’s warning that static YaRN “can slightly impact short-context quality” is confirmed, and “slightly” undersells it: BugFind drops 12 points (100 → 88, with category C at 67 and D at 80), HermesAgent drops 4, DataExtract and CLI-40 drop 1-2. The deterministic short suites (ToolCall, InstrucFollow) hold at exact parity. So the cost lands on the reasoning-heavy, multi-step suites — exactly where a local agent lives.
- Speed: 1M is 30-50% slower on long-output work. With the machine up and the artifact removed, the long-output suites (BugFind, DataExtract, HermesAgent) run 30-50% slower at the 1M ceiling than at 262K; CLI-40 ~16% slower; ToolCall at parity. The 1M ceiling costs real time at generation, not just memory at reservation.
- Verdict: 1M context is an explicit trade-off, not a free capability. It costs both quality (on the reasoning-heavy suites) and speed. If your working set stays under 262K tokens, the 1M build buys you nothing and costs you ~12 points on BugFind and a third on wall-clock. If you genuinely need 500K-1M (long documents, very long agent sessions), it’s the only option — and now you know the price.
- Real capacity (from the startup log):
GPU KV cache size: 1,796,875 tokenson 59.7 GiB of KV memory, with 23.62 GiB of weights + 2.19 GiB peak activation. That’s ~1.8M KV tokens on 96 GB — vs. the ~2.3M MiaAI-Lab measured on a 128 GB DGX Spark. Practically: one full 1M-token sequence plus ~0.8M of headroom, or ~7 concurrent 262K sessions. - Still to add: a needle-in-a-haystack at rising depth (100K / 256K / 500K / 750K / 1M) to confirm the 1M ceiling actually retrieves from long context, not just reserves it.
- Thinking depth — the four configurations (off, xhigh, medium, low), measured on both quality and speed, at
temperature 0.6and 262K context to match the rest of the series. This is the dial that trades reasoning tokens against latency, so each level gets BenchLocal scores plus wall-clock per suite. The service runs one level at a time via--default-chat-template-kwargs({"enable_thinking": false}for off,{"reasoning_effort": "medium"|"low"}for the rest; xhigh is the default).
Throughput and TTFT numbers for each configuration will land with their respective parts.
Links
- Qwen3.6 benchmarks and vLLM recipe — the reference run and Docker setup
- Benchmarking Laguna-S-2.1-NVFP4 — official card vs. local results, and the gap between them
- Comparing LLMs on HermesAgent-20 — agentic benchmark across my local models
- The inverted cost model — why a local 27B as orchestrator
- Qwen/Qwen3.8-27B on HuggingFace — model card and official benchmarks
- unsloth/Qwen3.8-27B-NVFP4 on HuggingFace — the NVFP4 quant for part two
- MiaAI-Lab/Qwen3.8-27B-DGX-Spark-RTX-6000 — reference vLLM scripts for NVFP4 + 1M YaRN context
- vLLM recipe for Qwen3.8-27B — the launch configuration I’m basing these runs on
- BenchLocal.app — the benchmark suite used